
nyc_housing_sales <- readr::read_csv(
  "https://bcdanl.github.io/data/nyc_housing_sales.csv.gz"
)NYC Housing Market
Urban analytics
Housing
Explore New York City property sales, prices, building characteristics, neighborhoods, and change over time.
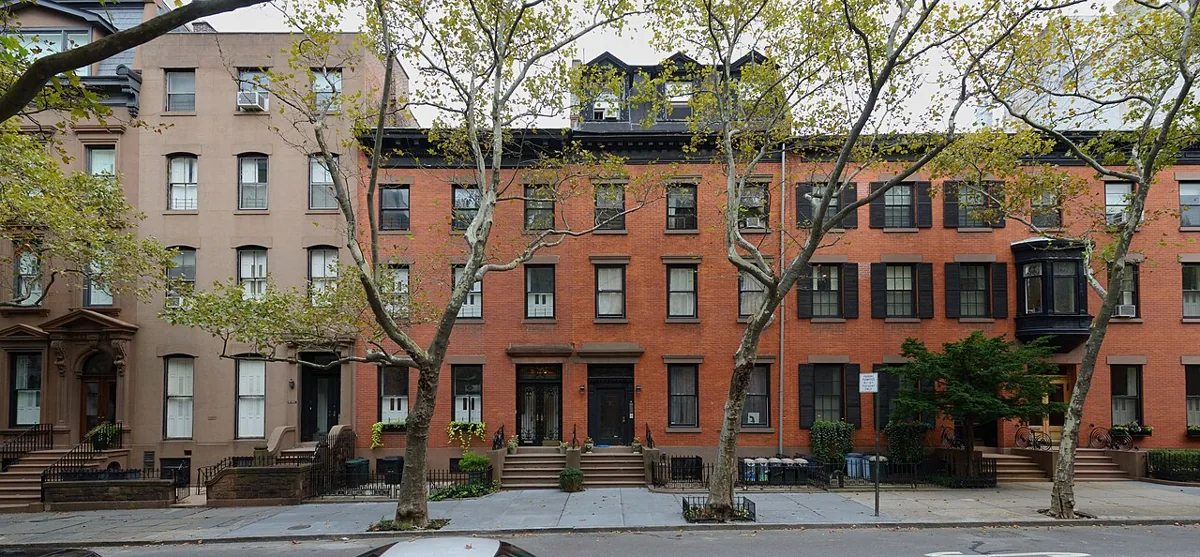
The nyc_housing_sales dataset combines earlier and current New York City property transactions from January 2003 through August 2026 in one CSV. Each row represents a sale and includes price, address, neighborhood, building classification, and property characteristics. The sample includes one-family dwellings and walkup co-ops with positive sale prices and land and building areas.
Explore the data on a map
Explore the project data by location. Select a location for details.
Loading the map…
Data
On-page tables preview a sample of rows. Download the files to analyze the complete datasets.
read_csv() downloads and decompresses this gzip CSV automatically.
Documentation
- NYC Finance annual sales files
- NYC Finance rolling sales files
- NYC property-sales glossary
- NYC building-class codes
Use these references before interpreting unfamiliar fields or grouping properties by building class.
Coverage and neighborhoods
Updated October 6, 2026. The 2024 and 2025 observations use the latest annual files. The 2026 observations come from the current rolling files, which cover September 2025 through August 2026 and were prepared September 9, 2026. Only 2026 rows from those rolling files are added, avoiding overlap with the annual files. The earlier classroom sample is retained.
neighborhood is the official NYC Finance sales neighborhood assigned to the property at its address. It is already available in the original files and is retained for every sale; neighborhoods are not guessed from ZIP codes. These labels are tax-sales neighborhoods and may differ from Census Neighborhood Tabulation Areas or everyday neighborhood names. Pair borough with neighborhood when comparing locations.
The source omitted one Queens address. It was filled from the official PLUTO property dataset using an exact borough, block, lot, and ZIP-code match. Its neighborhood remains the original DOF label.
The combined CSV contains 287,282 sales, including the 10,003 sales from 2023 omitted in the earlier size-limited download. All years from 2003 through 2026 are represented. Gzip compression keeps the download at 6.30 MB (6,295,804 bytes), below 30 MB, while preserving all 11 variables. The uncompressed CSV is 30.49 MB.
The 2026 observations cover January–August only; compare the same months across years when studying annual change. The sample excludes other building classes, zero-price transfers, invalid ZIP codes, missing or nonpositive areas, and implausible construction years. It does not represent all NYC property sales.
Variables to know
| Variable | Meaning |
|---|---|
borough, neighborhood |
Borough and official DOF sales neighborhood for the sale address |
address, zip_code |
Property street address and ZIP code |
building_class_category |
One-family dwellings or walkup co-ops |
residential_units |
Residential units recorded for the property |
land_square_feet, gross_square_feet |
Land area and gross building area in square feet |
year_built |
Recorded construction year |
sale_price, sale_date |
Transaction price in nominal dollars and sale date |
Possible story directions
- How have typical sale prices changed across boroughs or neighborhoods?
- Which building classes account for the most transactions?
- How do one-family dwellings and walkup co-ops differ?
- Are there periods with unusual transaction volume or price movement?
- How strongly are property size and sale price related within comparable building classes?
A useful first pass
Check the date range, missing values, duplicate records, and implausible prices before creating charts. Housing data often contains nominal transfers and unusual transactions, so explain any filtering rules clearly.