Classwork 1
NYC311 Dashboard - From a visible pattern to a responsible next step
Suppose you are advising a New York City agency manager. The manager wants to know where to investigate first before deciding how to use limited staff or outreach resources.
Open the NYC311 Service Request Maps
Use the detailed map so you can select a fiscal year, month, complaint type, and geographic view.
- Choose Community Board as the geographic view.
- Choose the Fiscal Year, Month, and Complaint Type.
- Hover your mouse pointer over a community district on the map to see that community’s request count and related information.
Start here: compare two Bronx districts
Community Board → FY2026 → January → HEAT/HOT WATER
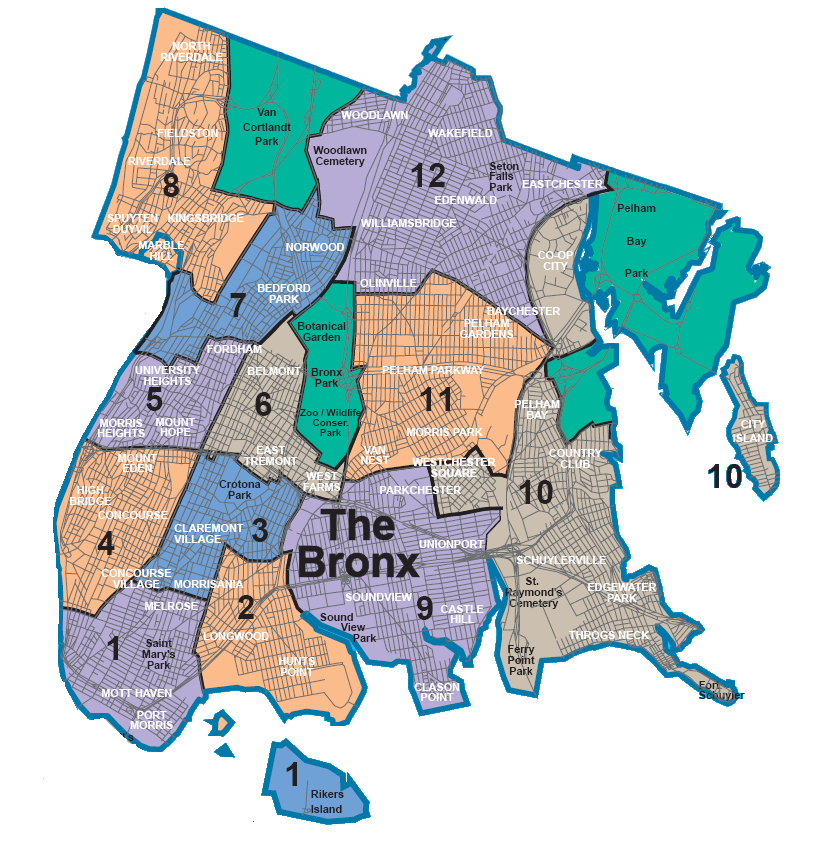
Bronx CD7 vs CD10
- CD7: Bedford Park, Fordham, and Norwood
- CD10: Co-op City, Pelham Bay, and Throgs Neck
Record both request counts, then discuss:
- How large is the difference?
- What should NYC investigate next?
- What can 311 request counts not tell us?
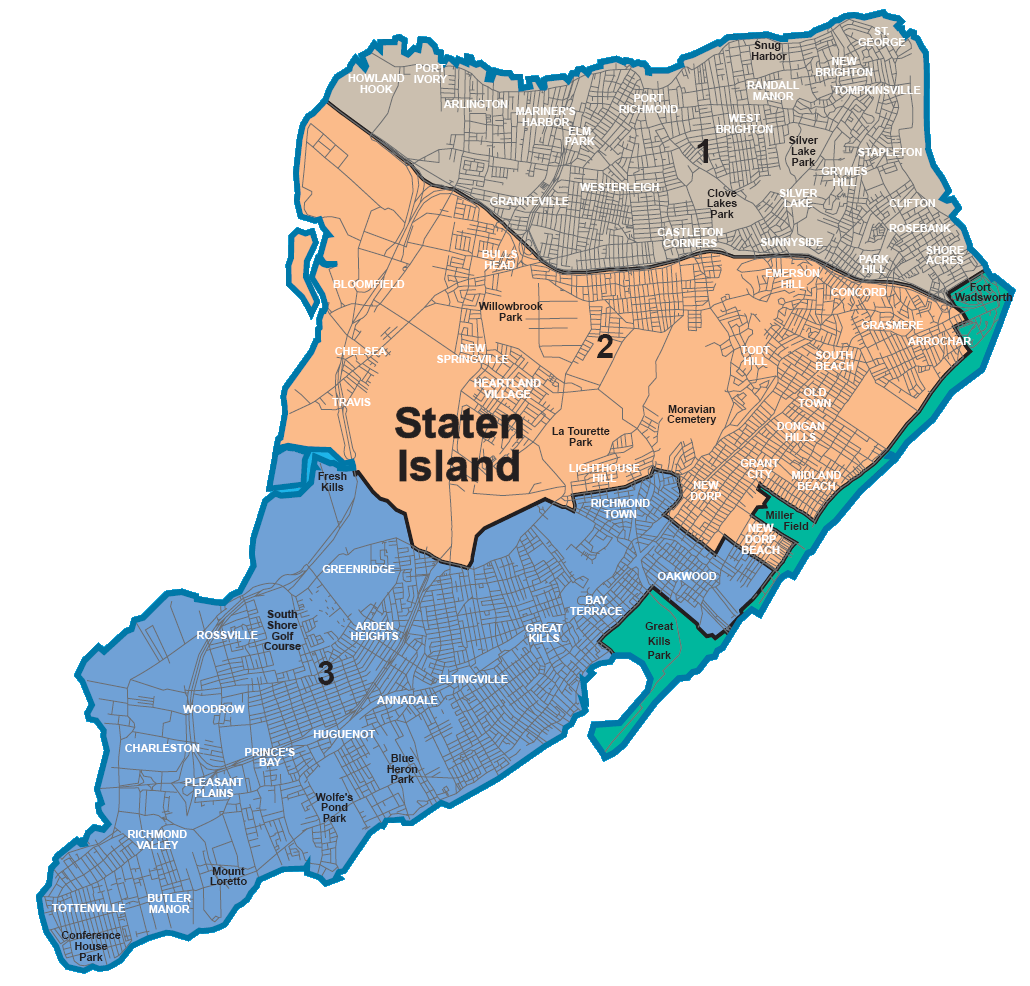
A numbered CD is a Community District. Each district has a corresponding Community Board. A City Council District is a separate geography with different boundaries.
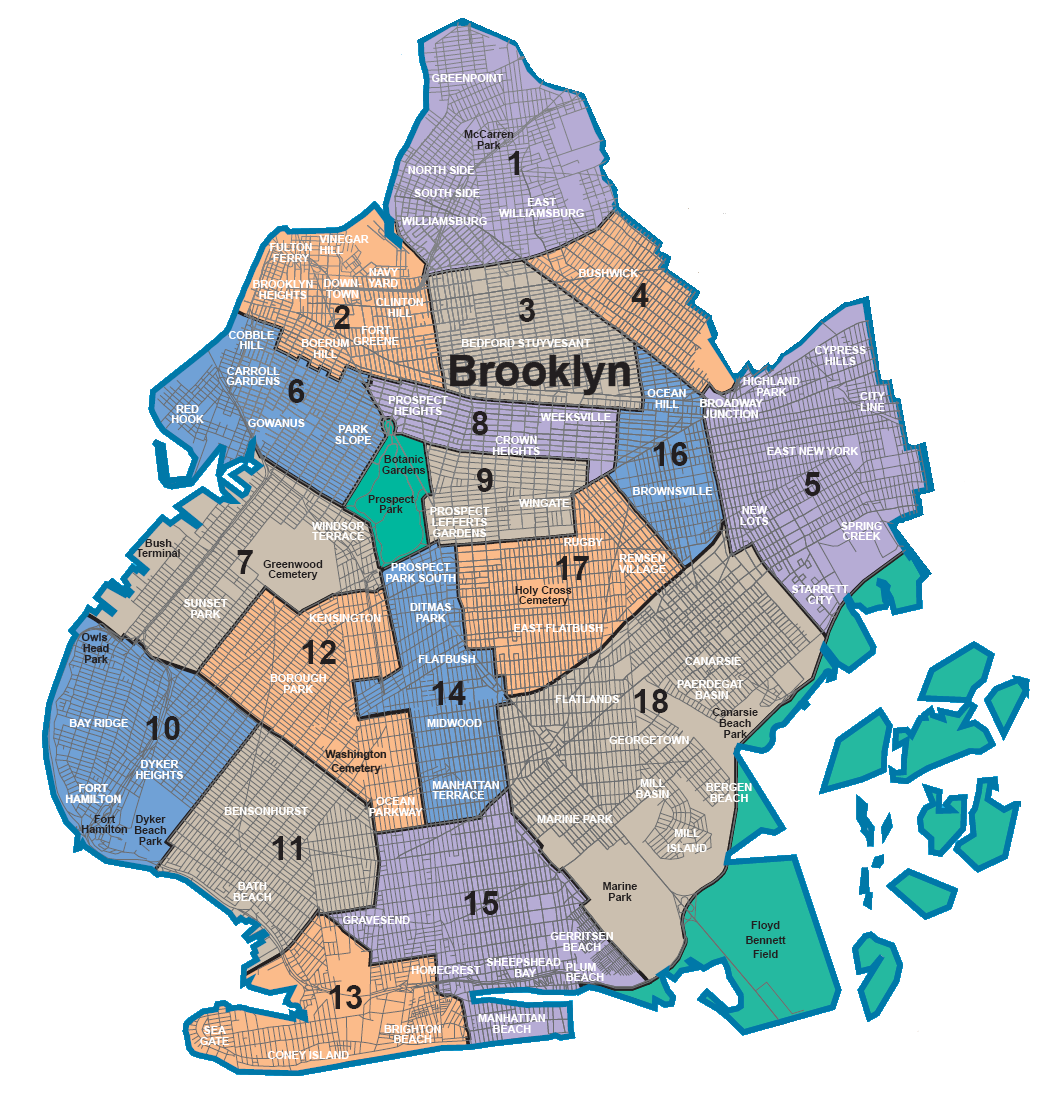
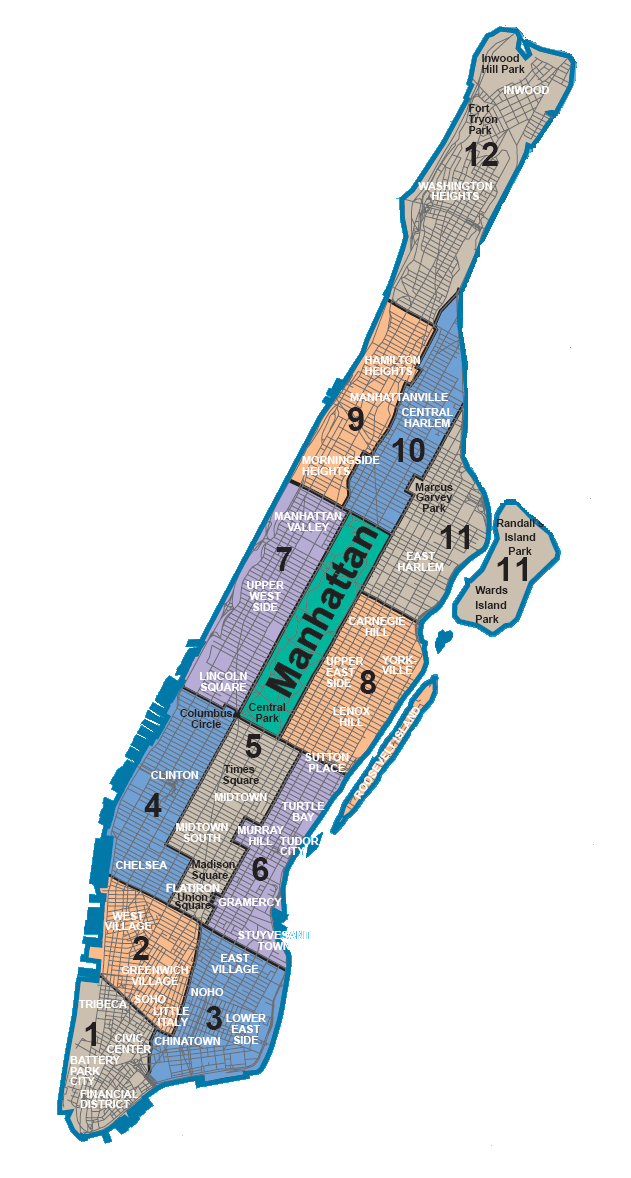
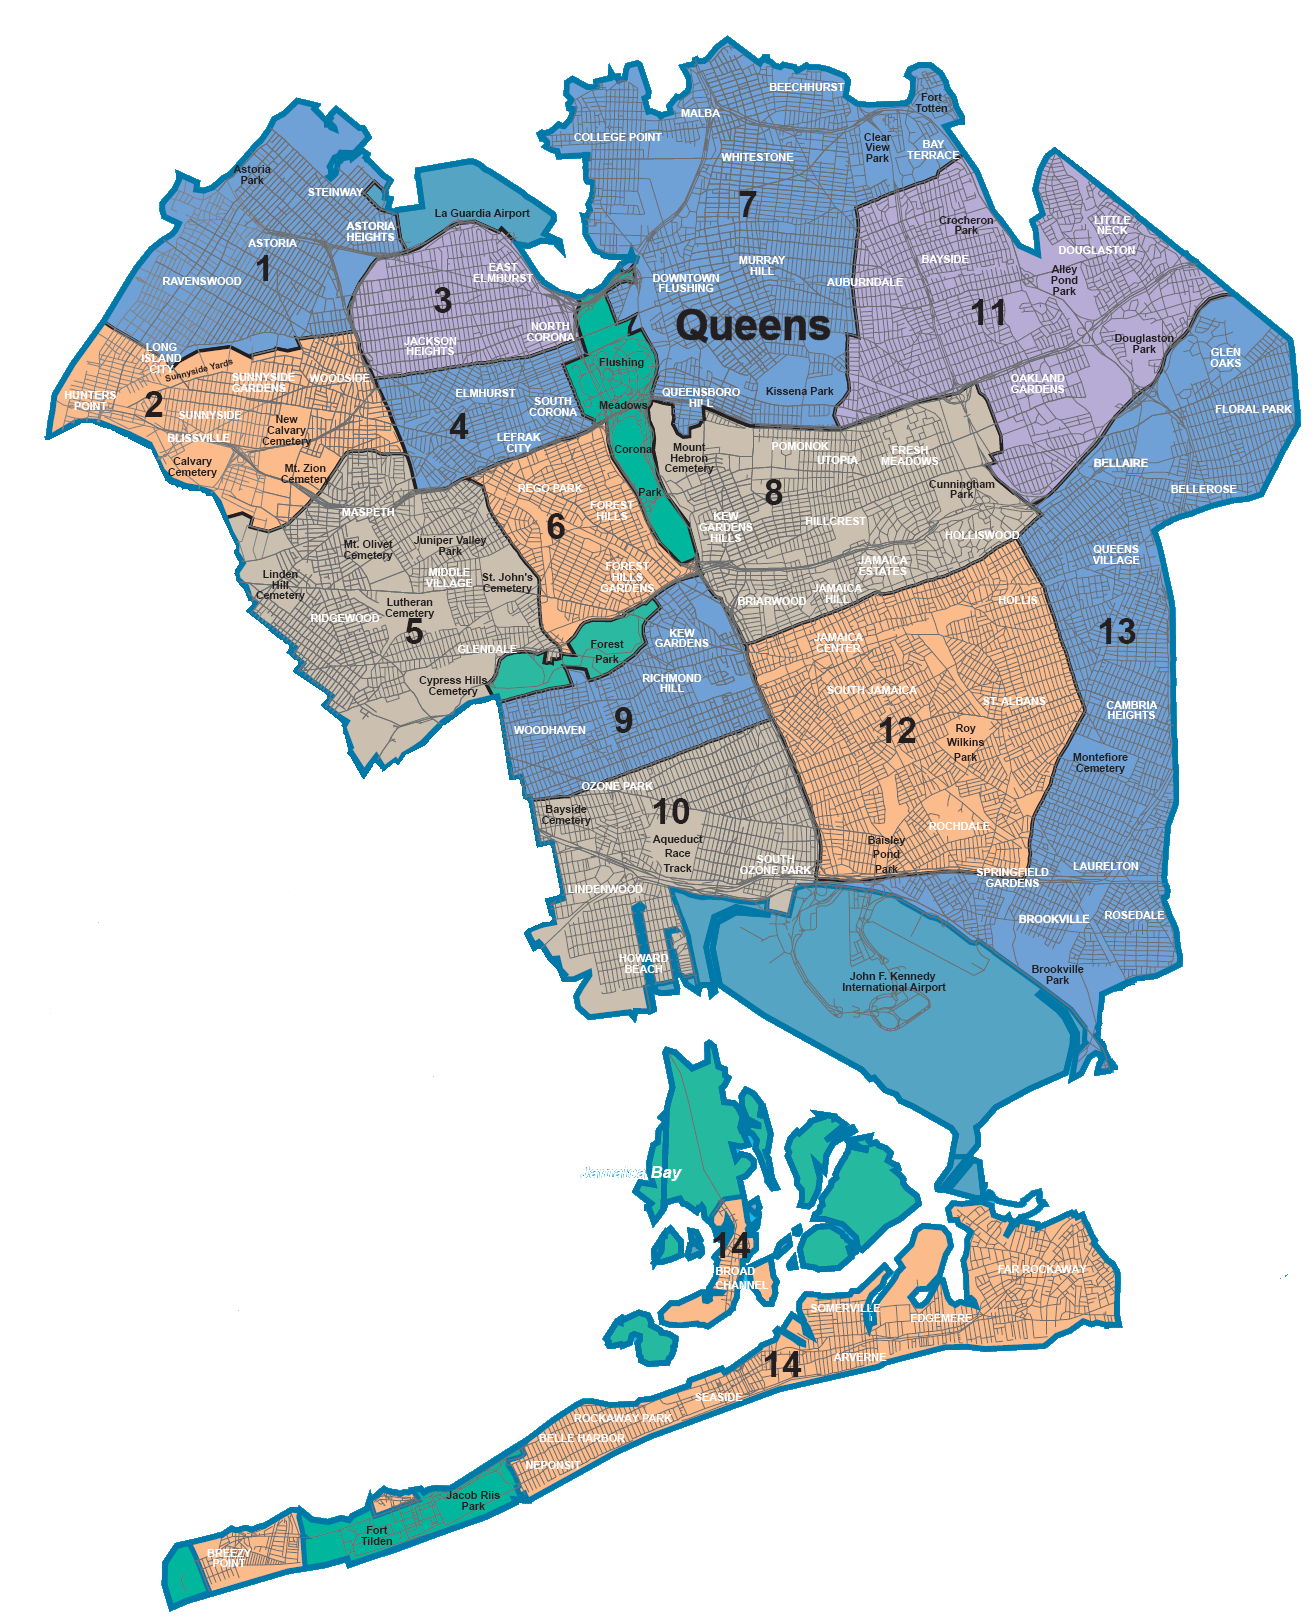
Community District maps for all five boroughs
Use the borough name with the district number because district numbers repeat across boroughs.
Bronx
Brooklyn
Manhattan
Queens
Staten Island
Try another comparison
If another group is already using the Bronx question, keep Community Board selected and choose one:
- FY2026 → May → Noise - Street/Sidewalk: Manhattan CD12 vs CD2
- FY2026 → August → Rodent: Manhattan CD11 vs CD1
- FY2026 → October → Blocked Driveway: Queens CD7 vs CD2
The dashboard supports month-level comparisons, not time-of-day filtering. Its latest completed month appears as Recent Month, so the named FY2026 months above make the activity reproducible.
Build a responsible recommendation
Prepare a short response:
In [month], the dashboard shows [count] [complaint type] requests in [area] and [count] in [comparison area]. NYC should first investigate [next step]. We cannot conclude [overstatement] because [limitation]. Before allocating resources, we would want [additional evidence].
Your response must include:
- one comparison from the dashboard;
- one tentative next step;
- one limitation; and
- one piece of additional evidence.
Interpret with care
- Areas differ in population, exposure, and the number of people using public space.
- Requests depend on awareness of 311, access, and willingness to report.
- The dashboard shows where and when requests were reported, but it does not by itself explain why the pattern occurred.
Example answer
In January of FY2026, the dashboard shows 4,277 HEAT/HOT WATER requests in Bronx CD7 and 675 in Bronx CD10—a difference of 3,602 requests, with CD7 reporting about 6.3 times as many.
NYC should first investigate whether CD7’s requests cluster at a small number of buildings or property owners, then compare those locations with recent housing inspections and maintenance violations.
We cannot conclude that CD7 has 6.3 times as much unmet heating need—or that CD10 has better housing conditions—because request totals can include repeat reports, the districts differ in population and housing stock, and residents may differ in their awareness of or willingness to use 311.
Before allocating resources, we would want request rates per occupied rental unit, the number of unique affected addresses, repeat-request rates, inspection findings, and resolution times.
Recommendation: Treat the dashboard pattern as a signal for further investigation, begin with high-request buildings in Bronx CD7, and compare normalized request rates and inspection evidence before shifting staff or outreach resources.
Sources
- NYC311 Service Request Maps
- NYC Community Board maps — borough maps designed by CUNY Baruch College
- Understanding Local Government in NYC
- 311 Service Requests from 2020 to Present