Midterm Exam
DANL 210-01, Spring 2026
Descriptive Statistics
Section 1. Python Fundamentals (Questions 1-7)
Question 1 (Points: 4)
What is the output of the following code?
x = [10, 20, 30, 40, 50]
y = x[:-2]
y.append(40)

print(y)
Show answer
[10, 20, 30, 40]Question 2 (Points: 4)
What is the output of the following code?
nums = [0, 1, 2, 3, 4]
total = 0

for n in nums:
    if n % 2 == 0:
        total = total + n
    else:
        total = total - n

print(total)
A. 0
B. 1
C. 2
D. 3
E. 4
Show answer
C. 2
Question 3 (Points: 4)
What is the output of the following code?
x = []
for num in range(1, 6):

    if num == 2:
        continue

    if num == 3:
        pass

    if num == 4:
        break

    x.append(num)

print(x)
A. [1, 2, 3, 4, 5]
B. [1, 2]
C. [1, 3]
D. [1, 2, 3]
E. [1, 2, 3, 4]
Show answer
C. [1, 3]
Question 4 (Points: 4)
What is the output of the following code?
vals = []
x = 0

while True:
    x += 1

    if x == 2:
        pass

    if x == 3:
        continue

    if x == 5:
        break

    vals.append(x)

print(vals)
A. [1, 2, 3, 4, 5]
B. [1, 2, 4]
C. [1, 4]
D. [2, 4]
E. [1, 2, 3, 4]
Show answer
B. [1, 2, 4]
Question 5 (Points: 4)
What is the output of the following code?
short_list = [1, 2, 3]
positions = [0, 3, 1]
result = []

for i in positions:
    try:
        result.append(short_list[i])
    except:
        result.append("error")

print(result)
A. [1, 3, 2]
B. [1, "error", 2]
C. [1, 2, 3]
D. ["error", 1, 2]
E. Error
Show answer
B. [1, "error", 2]
Question 6 (Points: 4)
What is the output of the following code?
scores = {"a": 10, "b": 20}
scores.update({"b": 5, "c": 15})
del scores["a"]
print(sum(scores.values()))
A. 5
B. 15
C. 20
D. 25
E. 30
Show answer
C. 20
Question 7 (Points: 4)
Which of the following list comprehensions produces the same output as the code below?
nums = [1, 2, 3, 4]
result = []

for x in nums:
    if x != 2 and x < 4:
        result.append(x * 2)
A.
result = [x for x in nums if x != 2 and x < 4]B.
result = [x * 2 for x in nums if x != 2]C.
result = [x * 2 for x in nums if x != 2 and x < 4]D.
result = [x * 2 for x in nums if x <= 4]E.
result = [x * 2 for x in nums if x == 2 or x < 4]
Show answer
C.
result = [x * 2 for x in nums if x != 2 and x < 4]Section 2. Data Collection I (Questions 8-11)
# %%
# =============================================================================
# Setting up
# =============================================================================
import pandas as pd
import numpy as np
import os, time, random
from io import StringIO

# Import the necessary modules from the Selenium library
from selenium import webdriver  # Main module to control the browser
from selenium.webdriver.common.by import By  # Helps locate elements on the webpage
from selenium.webdriver.chrome.options import Options  # Allows setting browser options
from selenium.webdriver.support.ui import WebDriverWait
from selenium.webdriver.support import expected_conditions as EC
from selenium.common.exceptions import NoSuchElementException
from selenium.common.exceptions import TimeoutException
from selenium.common.exceptions import StaleElementReferenceException

# Set the working directory path
wd_path = '/Users/geneseo/Documents/DANL-210'
os.chdir(wd_path)  # Change the current working directory to wd_path
os.getcwd()  # Retrieve and return the current working directory

# Create an instance of Chrome options
options = Options()

# Initialize the Chrome WebDriver with the specified options
driver = webdriver.Chrome(options=options)

URL = "https://stockanalysis.com/stocks/screener/"
Question 8 (Points: 4)
- Write code to load the first/front page of the website for the
URLon the Chrome browser that is being controlled by automated test software, calledselenium.
Show answer
driver.get(URL)Question 9 (Points: 36)
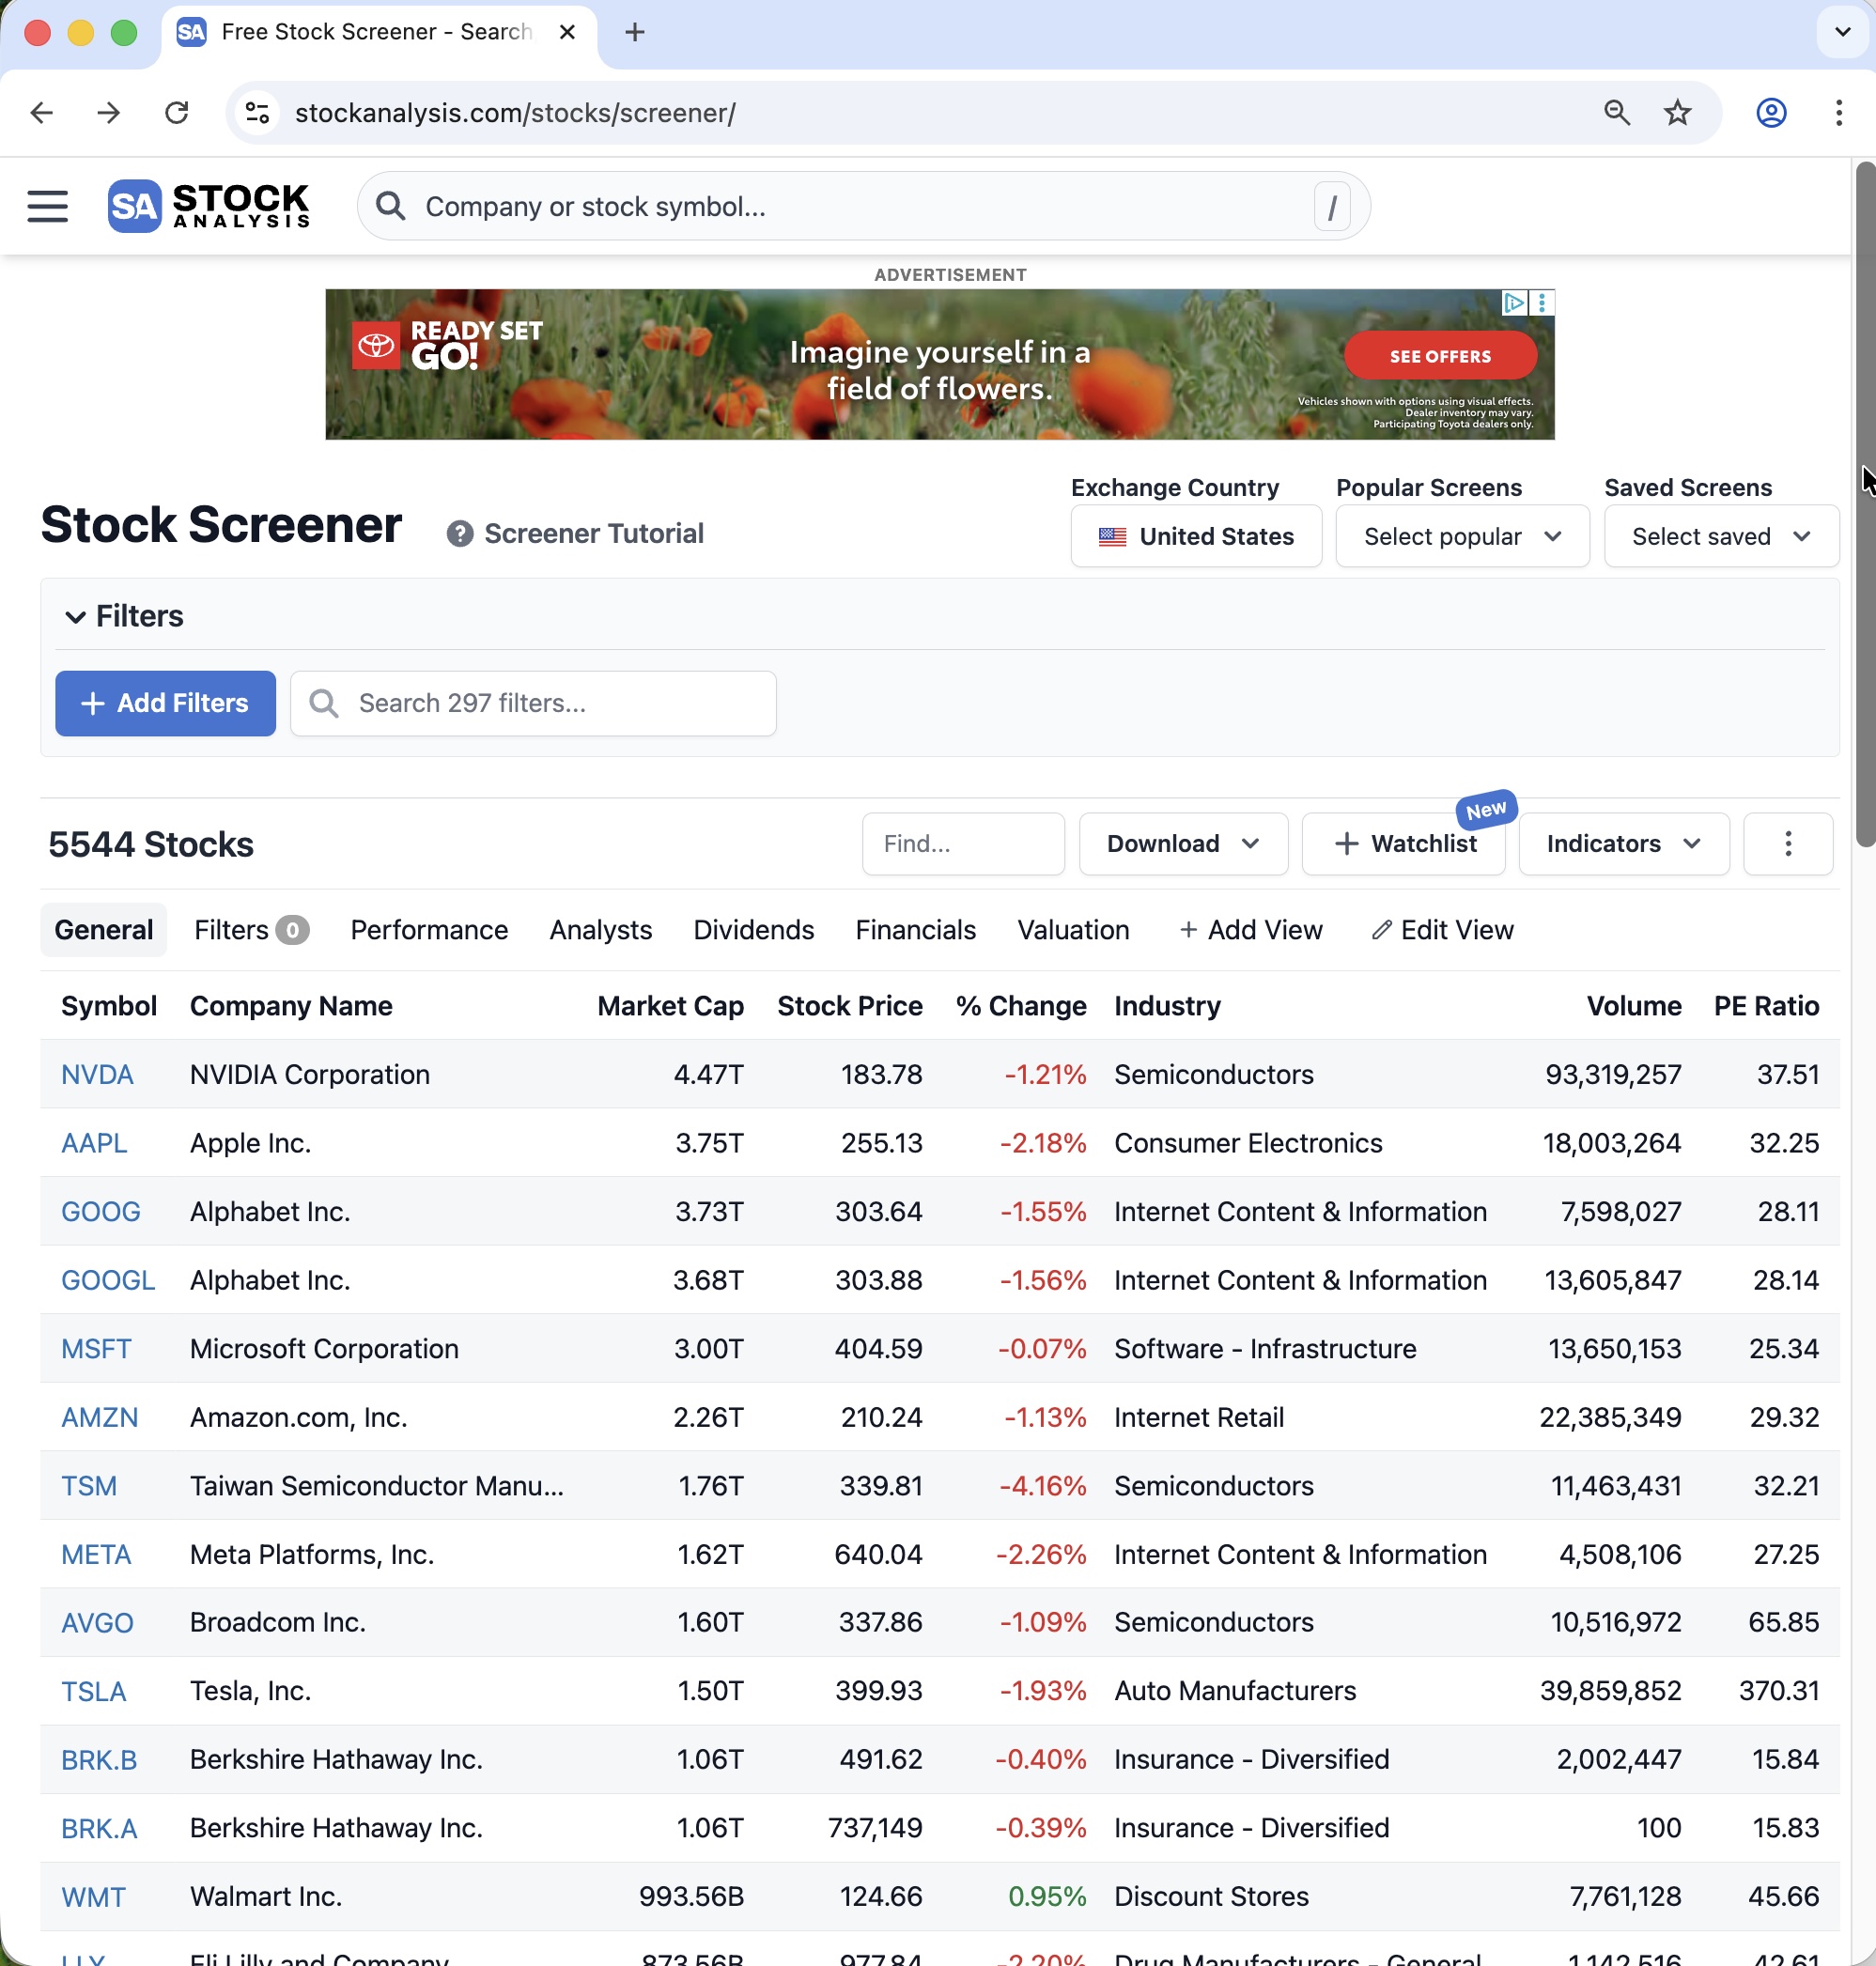
Suppose you open the website https://stockanalysis.com/stocks/screener/.
At the top of the first page, you can see the first page of a stock screener table, as shown below:
At the top of the page, the table appears with the HTML tag <table>, as shown below:
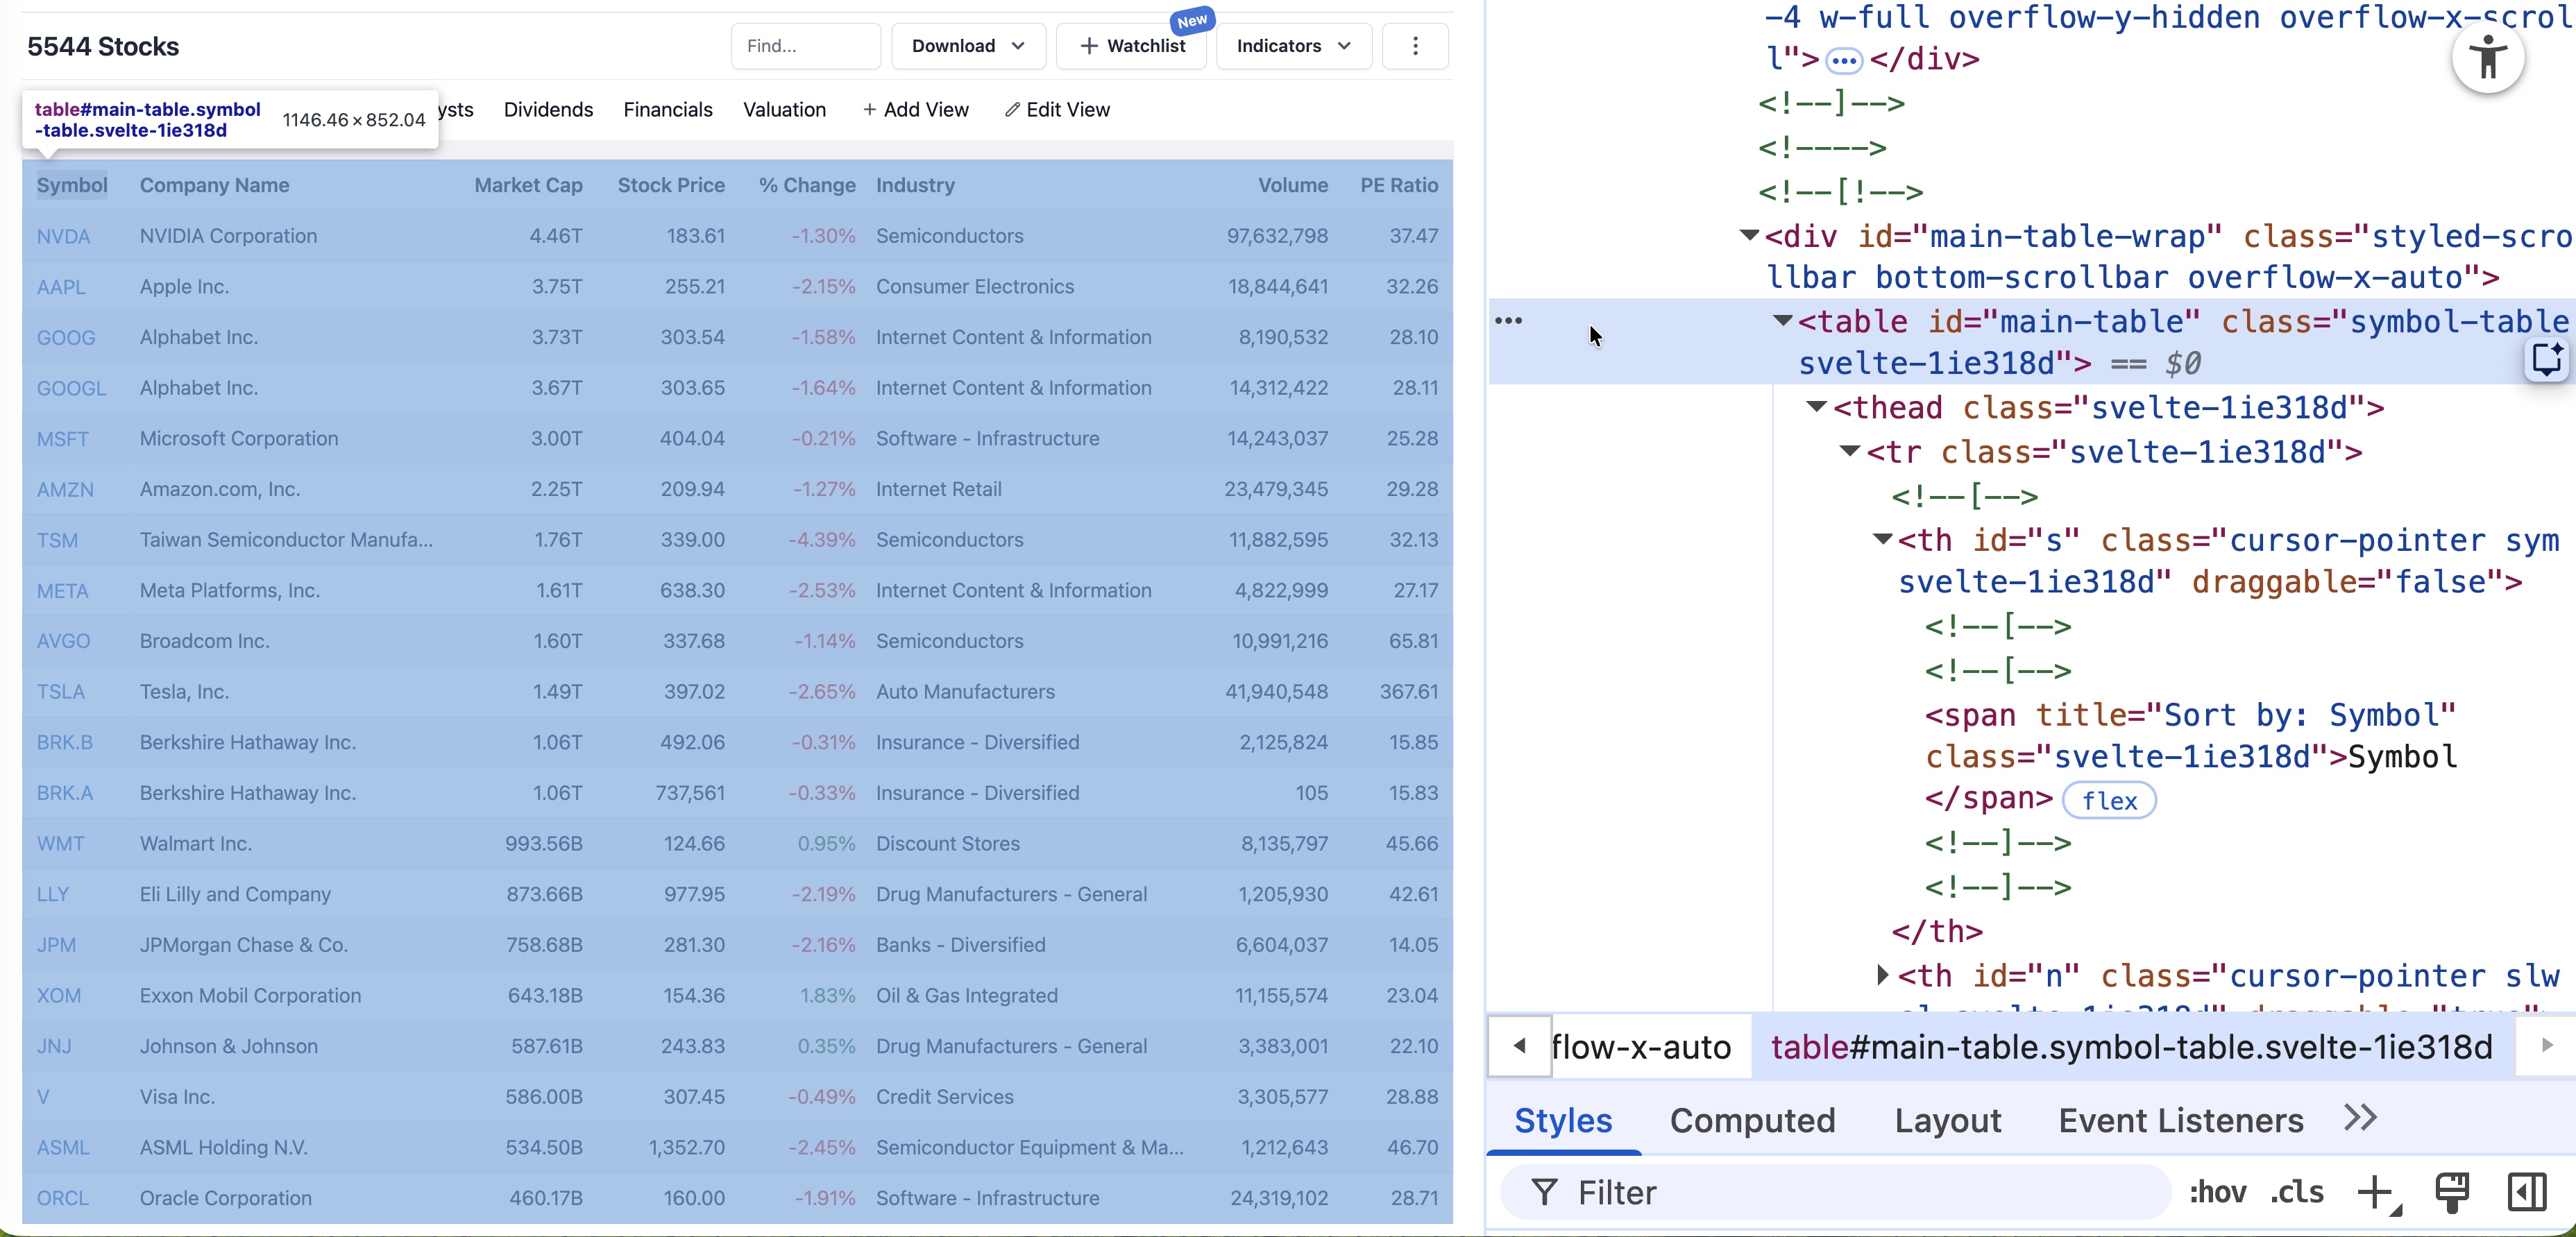
You cannot collect the table directly with pd.read_html(URL) because the server blocks that request and returns an HTTPError.
This website contains 278 pages of table data. To move from one page to the next, you must click the Next button.
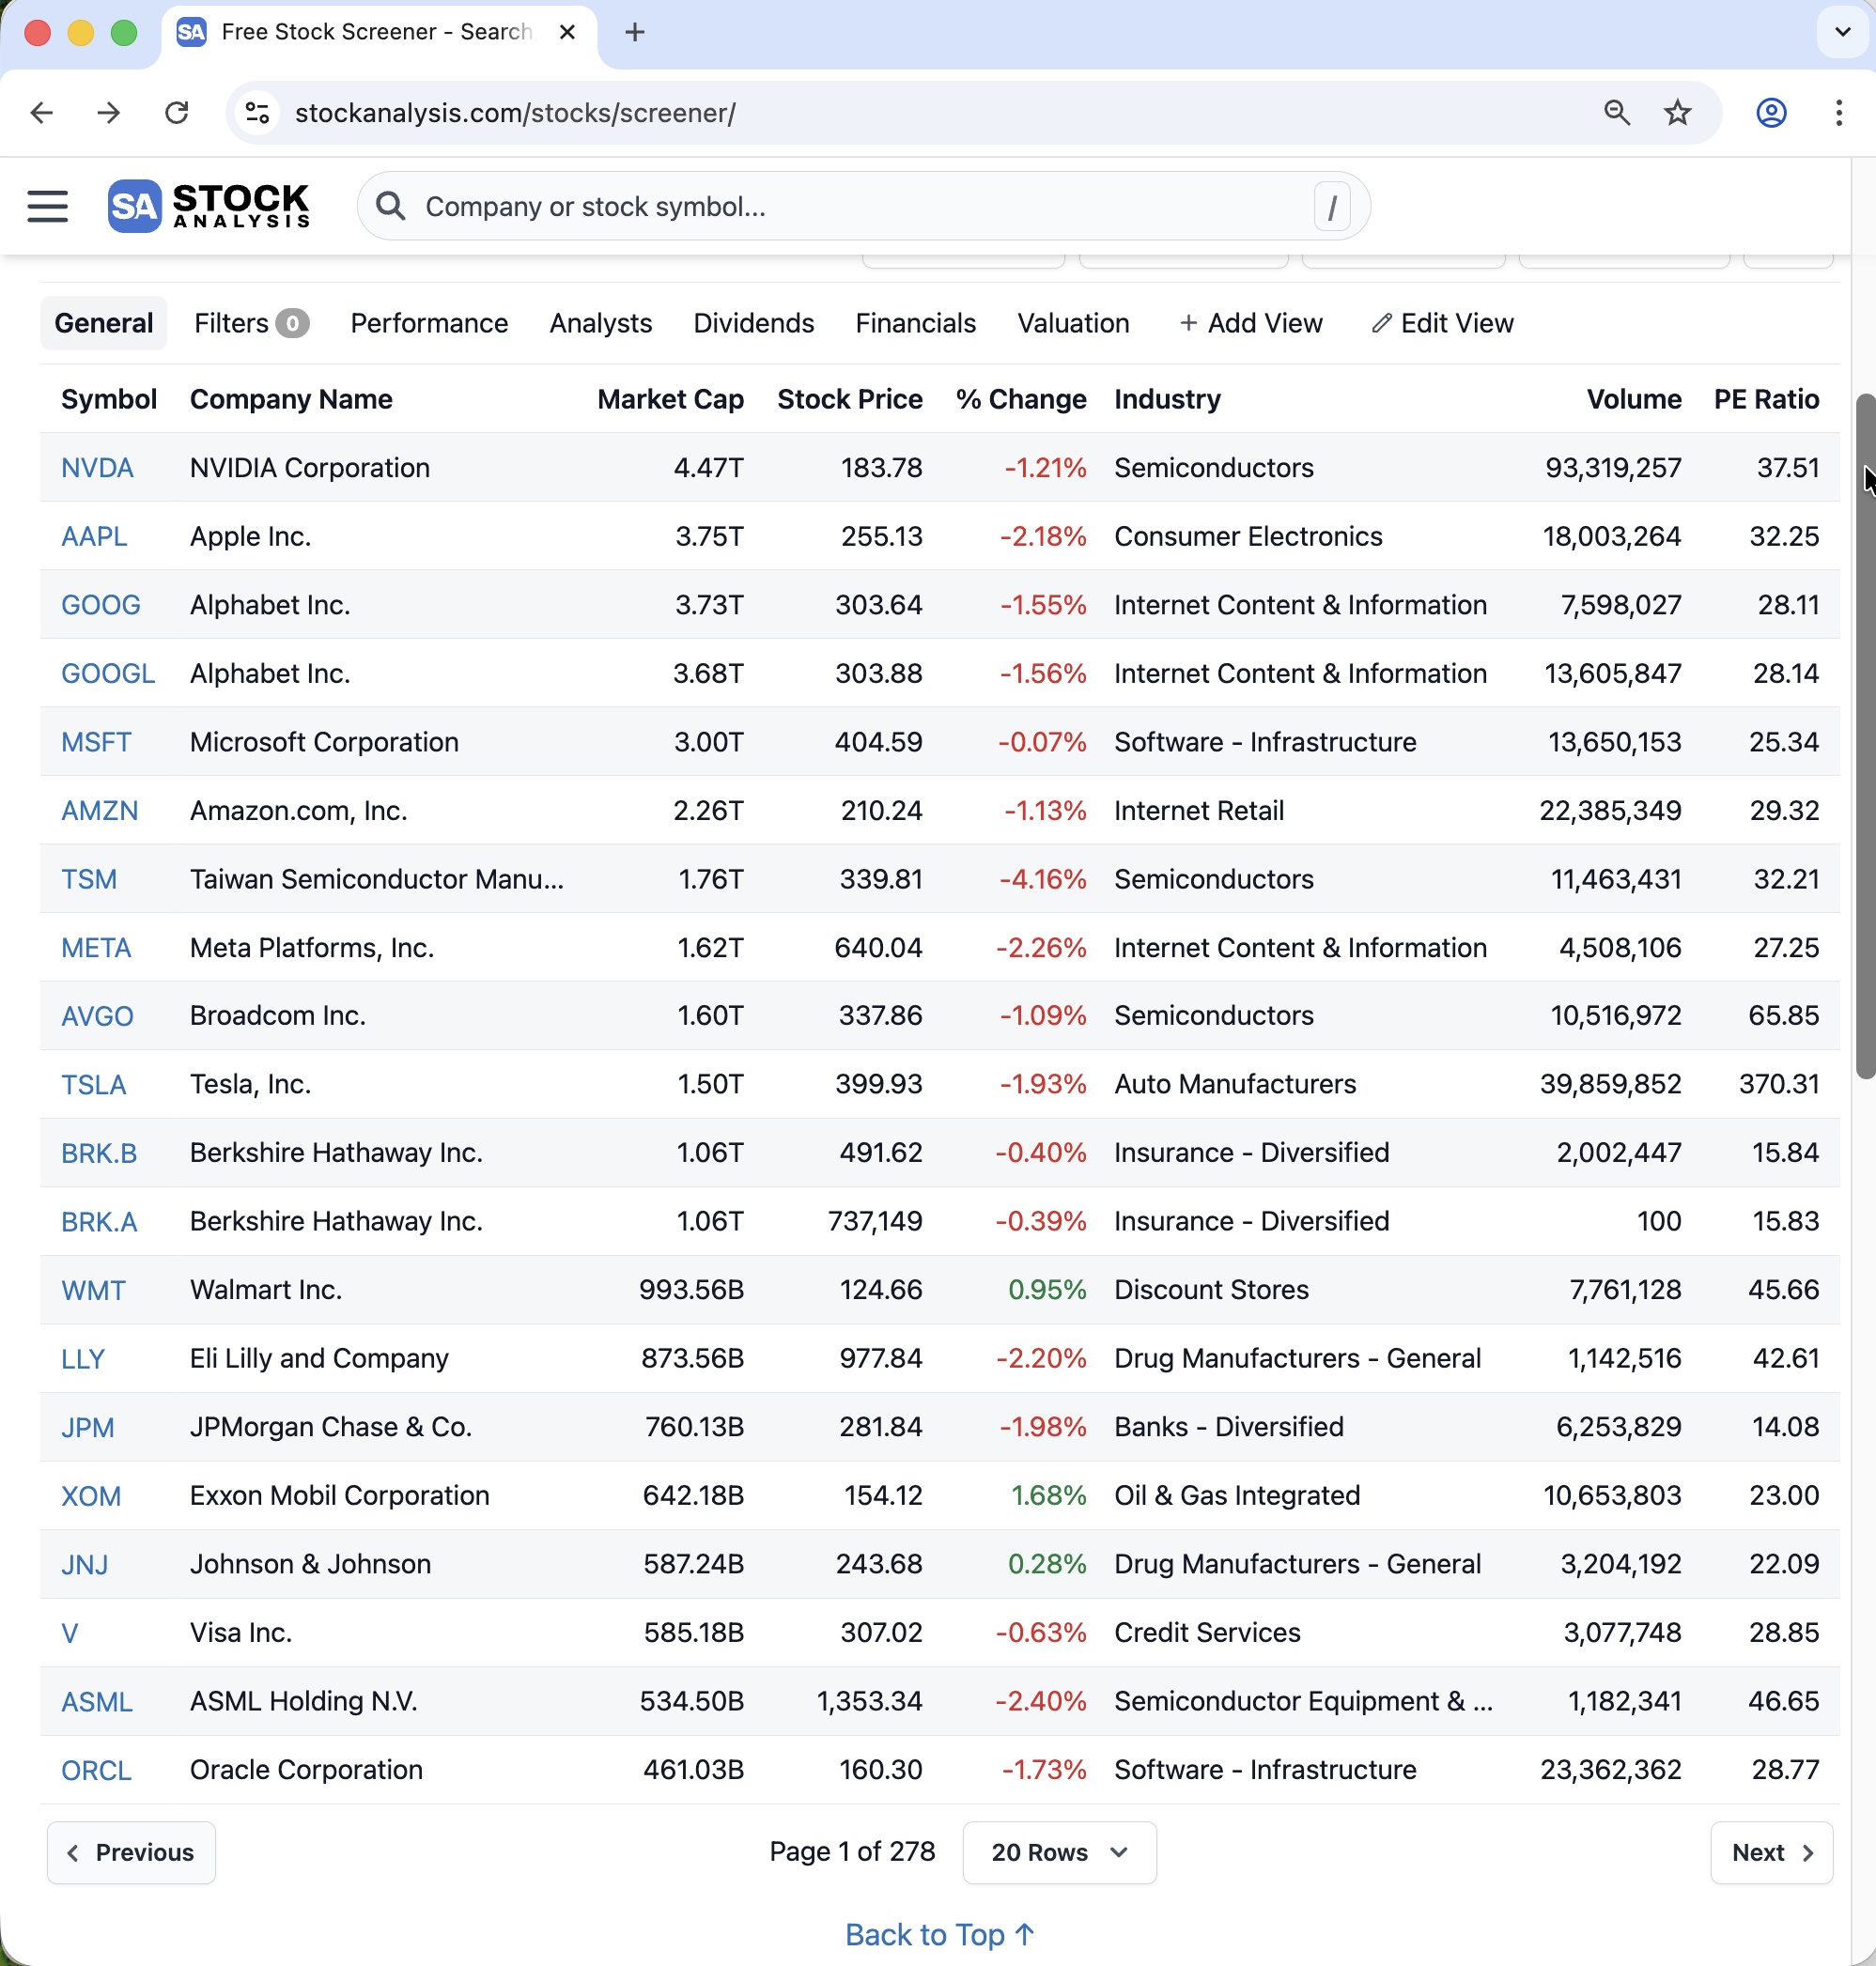
However, there is an important detail: the Next button does not appear in the HTML until you scroll down a little. For example, you can scroll down to about 500 pixels from the top by using:
scroll_500 = "window.scrollTo(0, 500);"
driver.execute_script(scroll_500)
After clicking Next, the browser moves to the next page, but it stays at about the same scroll position. At that position, the table is no longer visible, so you must scroll back to the top before finding the table again.
You can scroll back to the top by using:
scroll_0 = "window.scrollTo(0, 0);"
driver.execute_script(scroll_0)
Also note that the given URL opens only the first page directly. To access the remaining pages, you must keep clicking the Next button.
Task
Write Python code using a for-loop to collect the table data from all 278 pages of the website.
In each loop iteration, your code should:
- Scroll to the top of the page.
- Pause for 0.75 seconds.
- Find the table
WebElement. - Extract the HTML of the
<table>element. - Convert that HTML table into a pandas DataFrame.
- Add the DataFrame to one combined DataFrame containing all pages.
- Scroll down to the 500-pixel position.
- Pause for a random amount of time between 0.5 and 1 second.
- Find the Next button using the XPath below:
xpath_next_btn = '//*[@id="main"]/div[3]/nav[2]/button[2]/span'- Click the Next button.
- Pause for a random amount of time between 2 and 3 seconds.
scroll_0 = "window.scrollTo(0, 0);"
scroll_500 = "window.scrollTo(0, 500);"
xpath_next_btn = '//*[@id="main"]/div[3]/nav[2]/button[2]/span'

# _______________PROVIDE_YOUR_CODE_BELOW_______________
Show answer
# n_pages = driver.find_element(By.XPATH, '//*[@id="main"]/div[3]/nav[2]/div/span').text
# last_page = int(n_pages.split(" of ")[1])  # -> 278
last_page = 278

df_all = pd.DataFrame()
for i in range(last_page):

    # 1. Scroll to the top of the page.
    driver.execute_script(scroll_0)

    # 2. Pause for 0.75 seconds.
    time.sleep(0.75)

    # 3. Find the table `WebElement`
    table = driver.find_element(By.TAG_NAME, "table")
    # table = driver.find_element(By.ID, "main-table")

    # 4. Extract the HTML of the `<table>` element.
    table_html = table.get_attribute("outerHTML")

    # 5. Convert that HTML table into a pandas DataFrame.
    df = pd.read_html(StringIO(table_html))[0]

    # 6. Add the DataFrame to one combined DataFrame containing all pages.
    df_all = pd.concat([df_all, df], ignore_index=True)

    # 7. Scroll down to the 500-pixel position.
    driver.execute_script(scroll_500)

    # 8. Pause for a random amount of time between 0.5 and 1 second.
    time.sleep(random.uniform(0.5, 1))

    # 9. Find the **Next** button
    btn = driver.find_element(By.XPATH, xpath_next_btn)

    # 10. Click the **Next** button.
    btn.click()

    # 11. Pause for a random amount of time between 2 and 3 seconds.
    time.sleep(random.uniform(2, 3))
Question 10 (Points: 6)
Write one-line code to export the final DataFrame with all table data as a CSV file named stock_screener.csv inside the data subfolder of the current working directory given by wd_path.
- Ensure that the CSV does not include row index of the
df_allDataFrame. - Use a relative path.
Show answer
df_all.to_csv("data/stock_screener.csv", index = False)Question 11 (Points: 4)
- Write a one-line code to close the Chrome browser that is being controlled by automated test software, called
selenium.
Show answer
driver.quit()Section 3. Data Collection II (Question 12)
The code below fetches the Premier League’s top-15 scorers for the 2025–26 season (year = ‘2025’) from the Premier League API (which powers the Stats Center at https://www.premierleague.com/en/stats/top/players?statMetric=goals&season=2025):
import pandas as pd
import random, time
import requests
headers = {
'User-Agent': 'Mozilla/5.0 (Macintosh; Intel Mac OS X 10.15; rv:148.0) Gecko/20100101 Firefox/148.0',
'Accept': '*/*',
'Accept-Language': 'en-US,en;q=0.9',
# 'Accept-Encoding': 'gzip, deflate, br, zstd',
'Referer': 'https://www.premierleague.com/',
'x-pulse-application-name': 'web',
'x-pulse-application-version': 'v1.40.15',
'Origin': 'https://www.premierleague.com',
'Connection': 'keep-alive',
'Sec-Fetch-Dest': 'empty',
'Sec-Fetch-Mode': 'cors',
'Sec-Fetch-Site': 'cross-site',
'Priority': 'u=4',
# Requests doesn't support trailers
# 'TE': 'trailers',
}
params = {
'_sort': 'goals:desc',
'country': '',
'_limit': '15',
}
url = 'https://sdp-prem-prod.premier-league-prod.pulselive.com/api/v3/competitions/8/seasons/'
endpoint = '/players/stats/leaderboard'
year = '2025'
api_endpoint_2025 = url + year + endpoint
response = requests.get(
api_endpoint_2025,
params=params,
headers=headers,
)
content = response.json()
content_data = content['data']
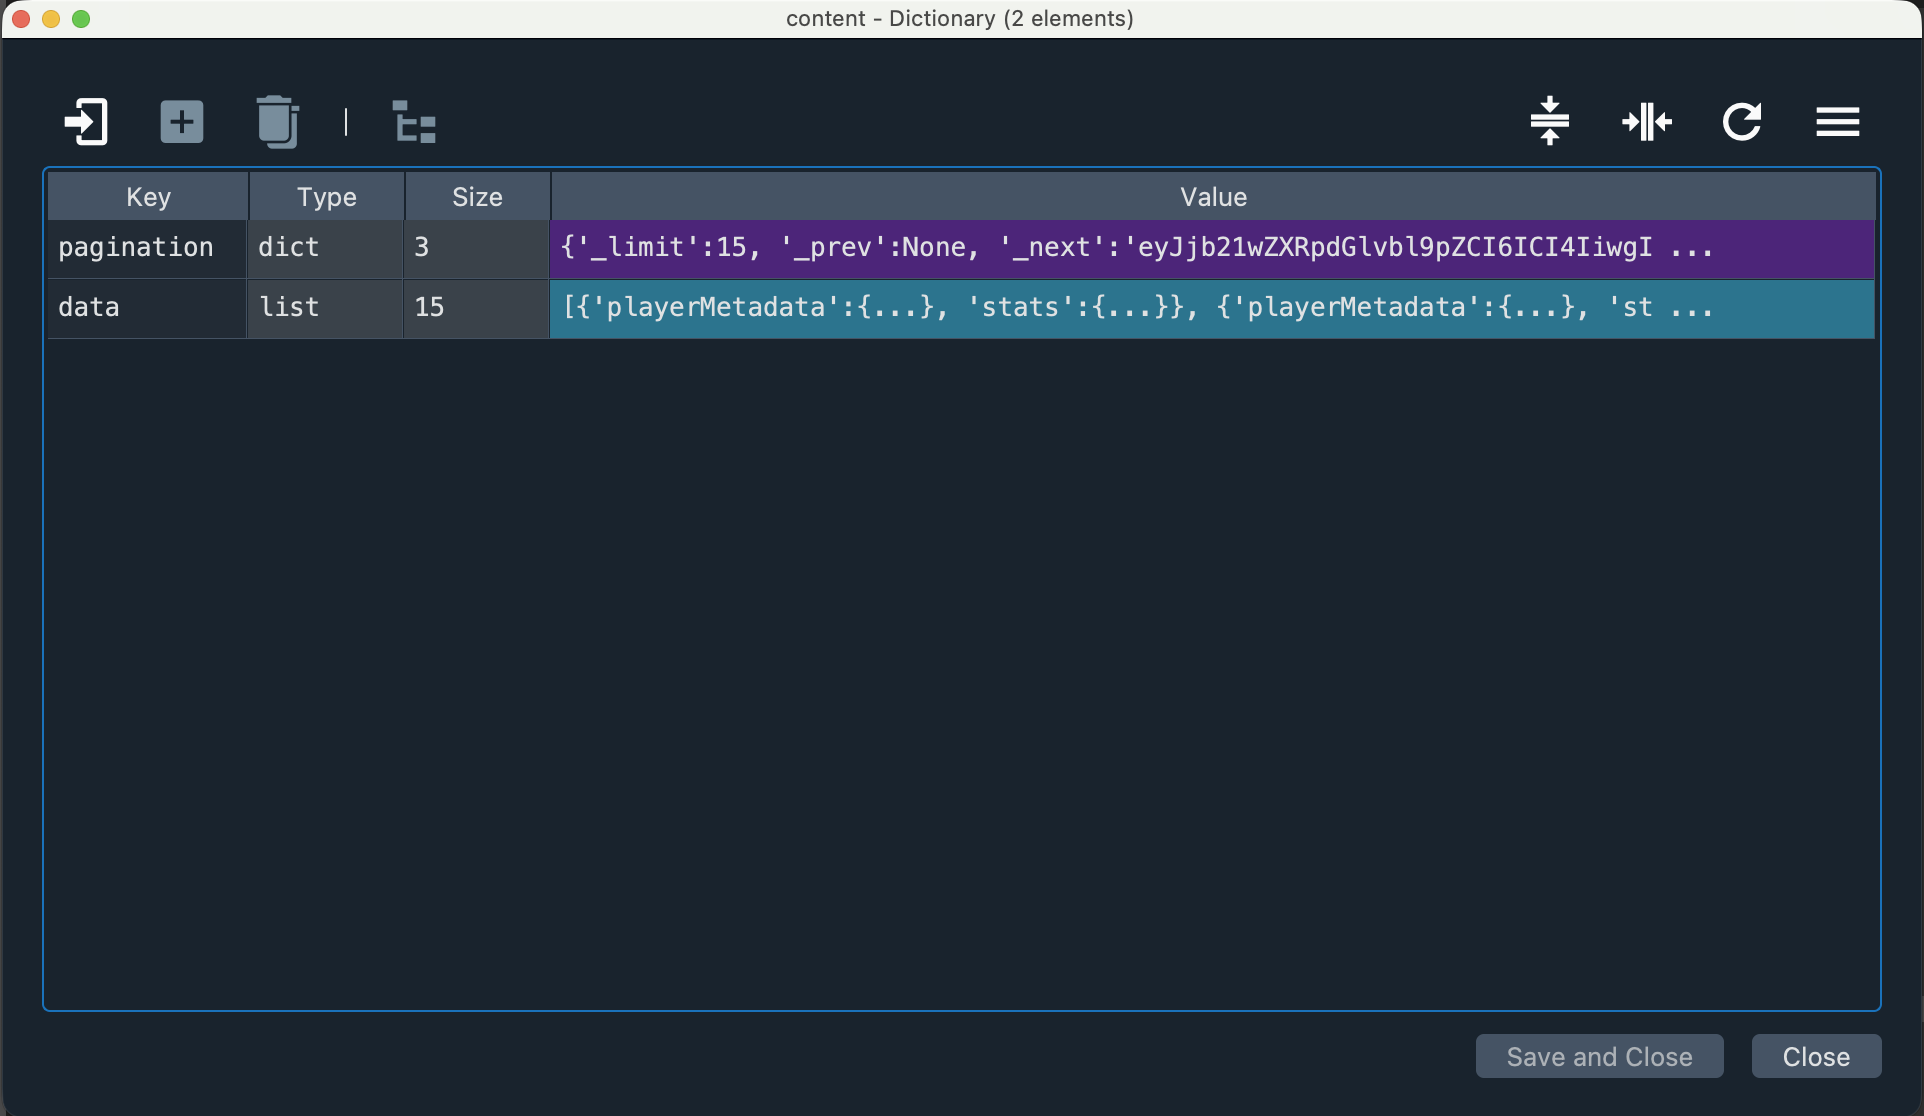
df = pd.json_normalize(content_data)Below is the content dictionary:
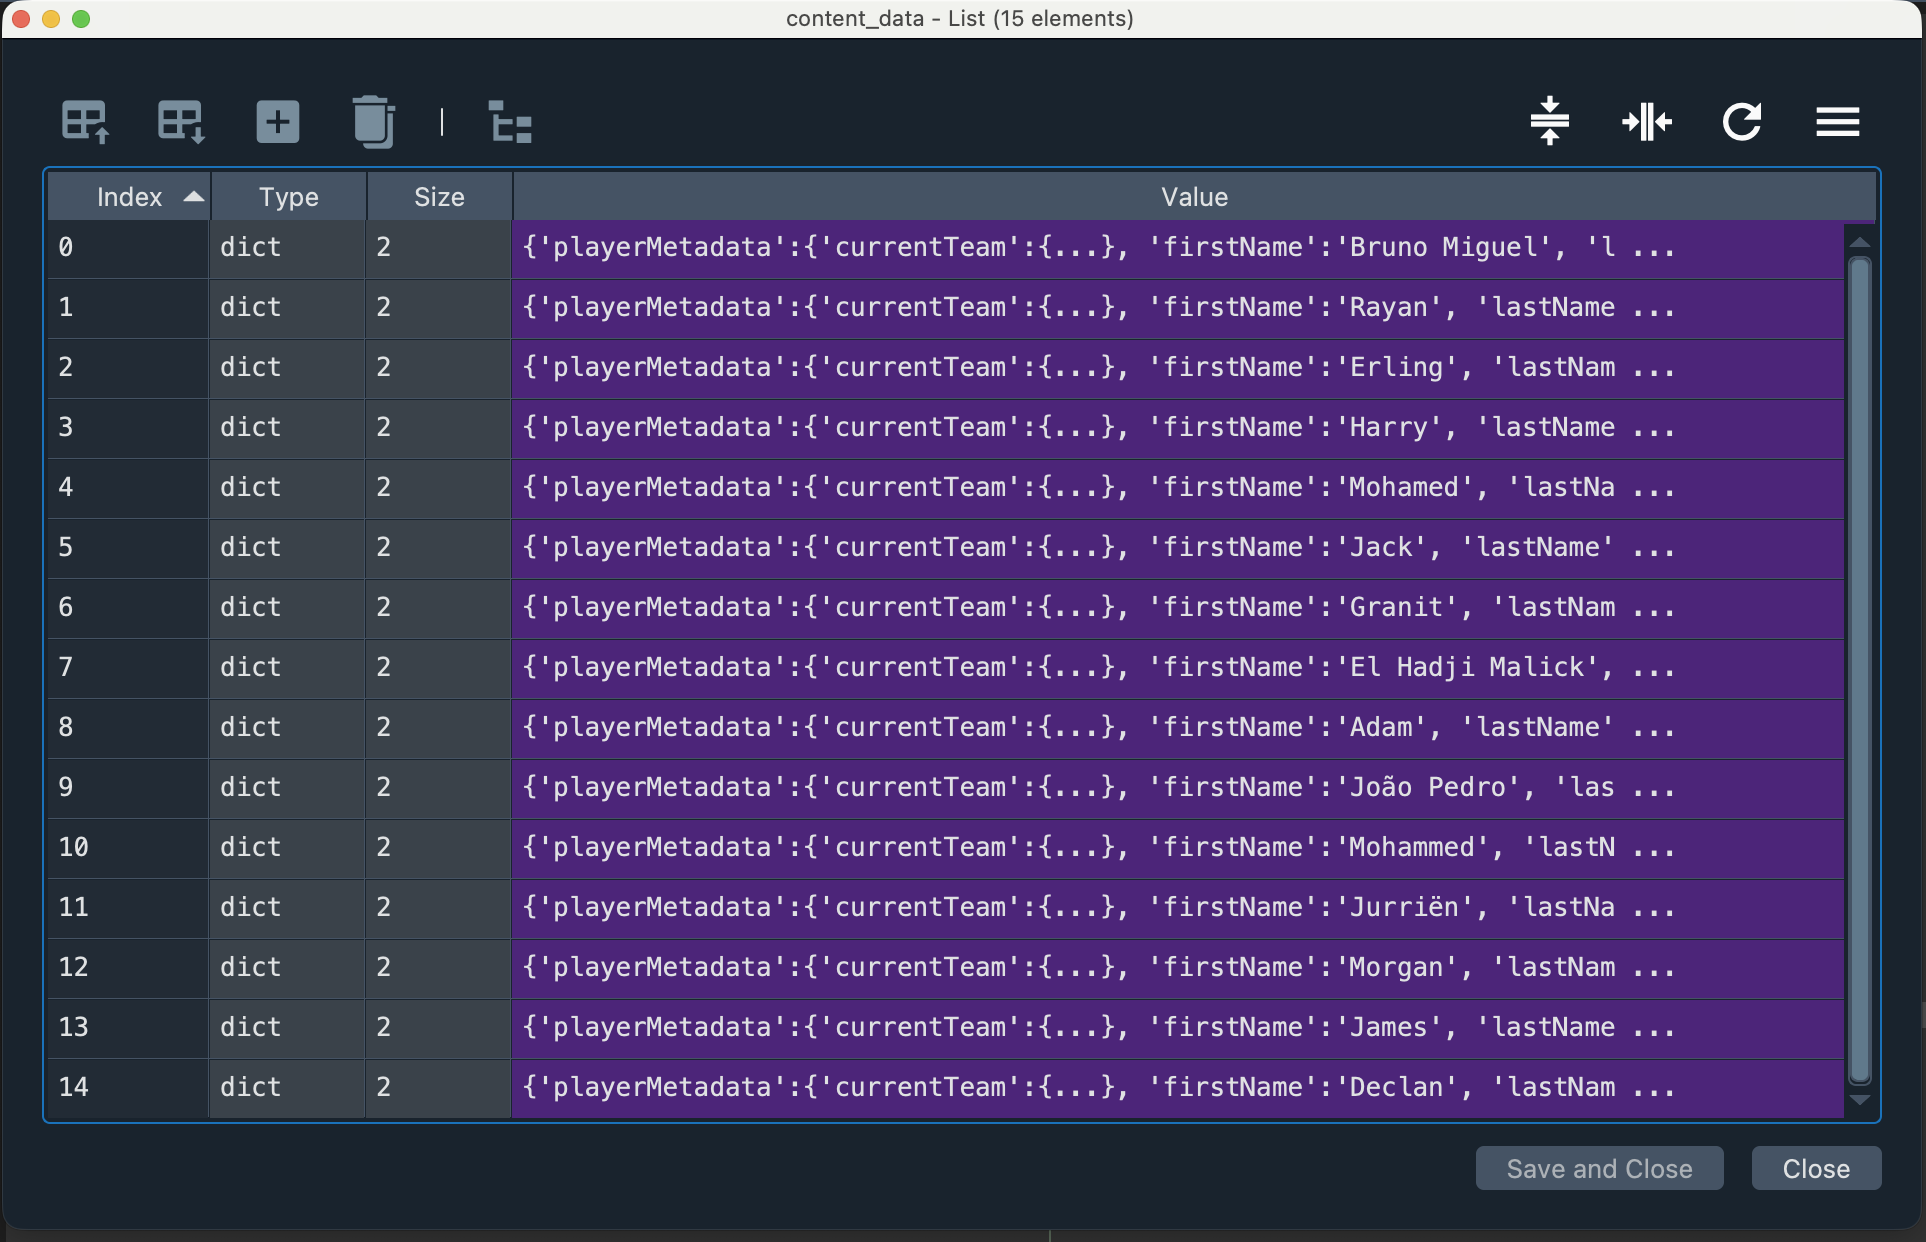
Below is the content_data list of dictionaries:
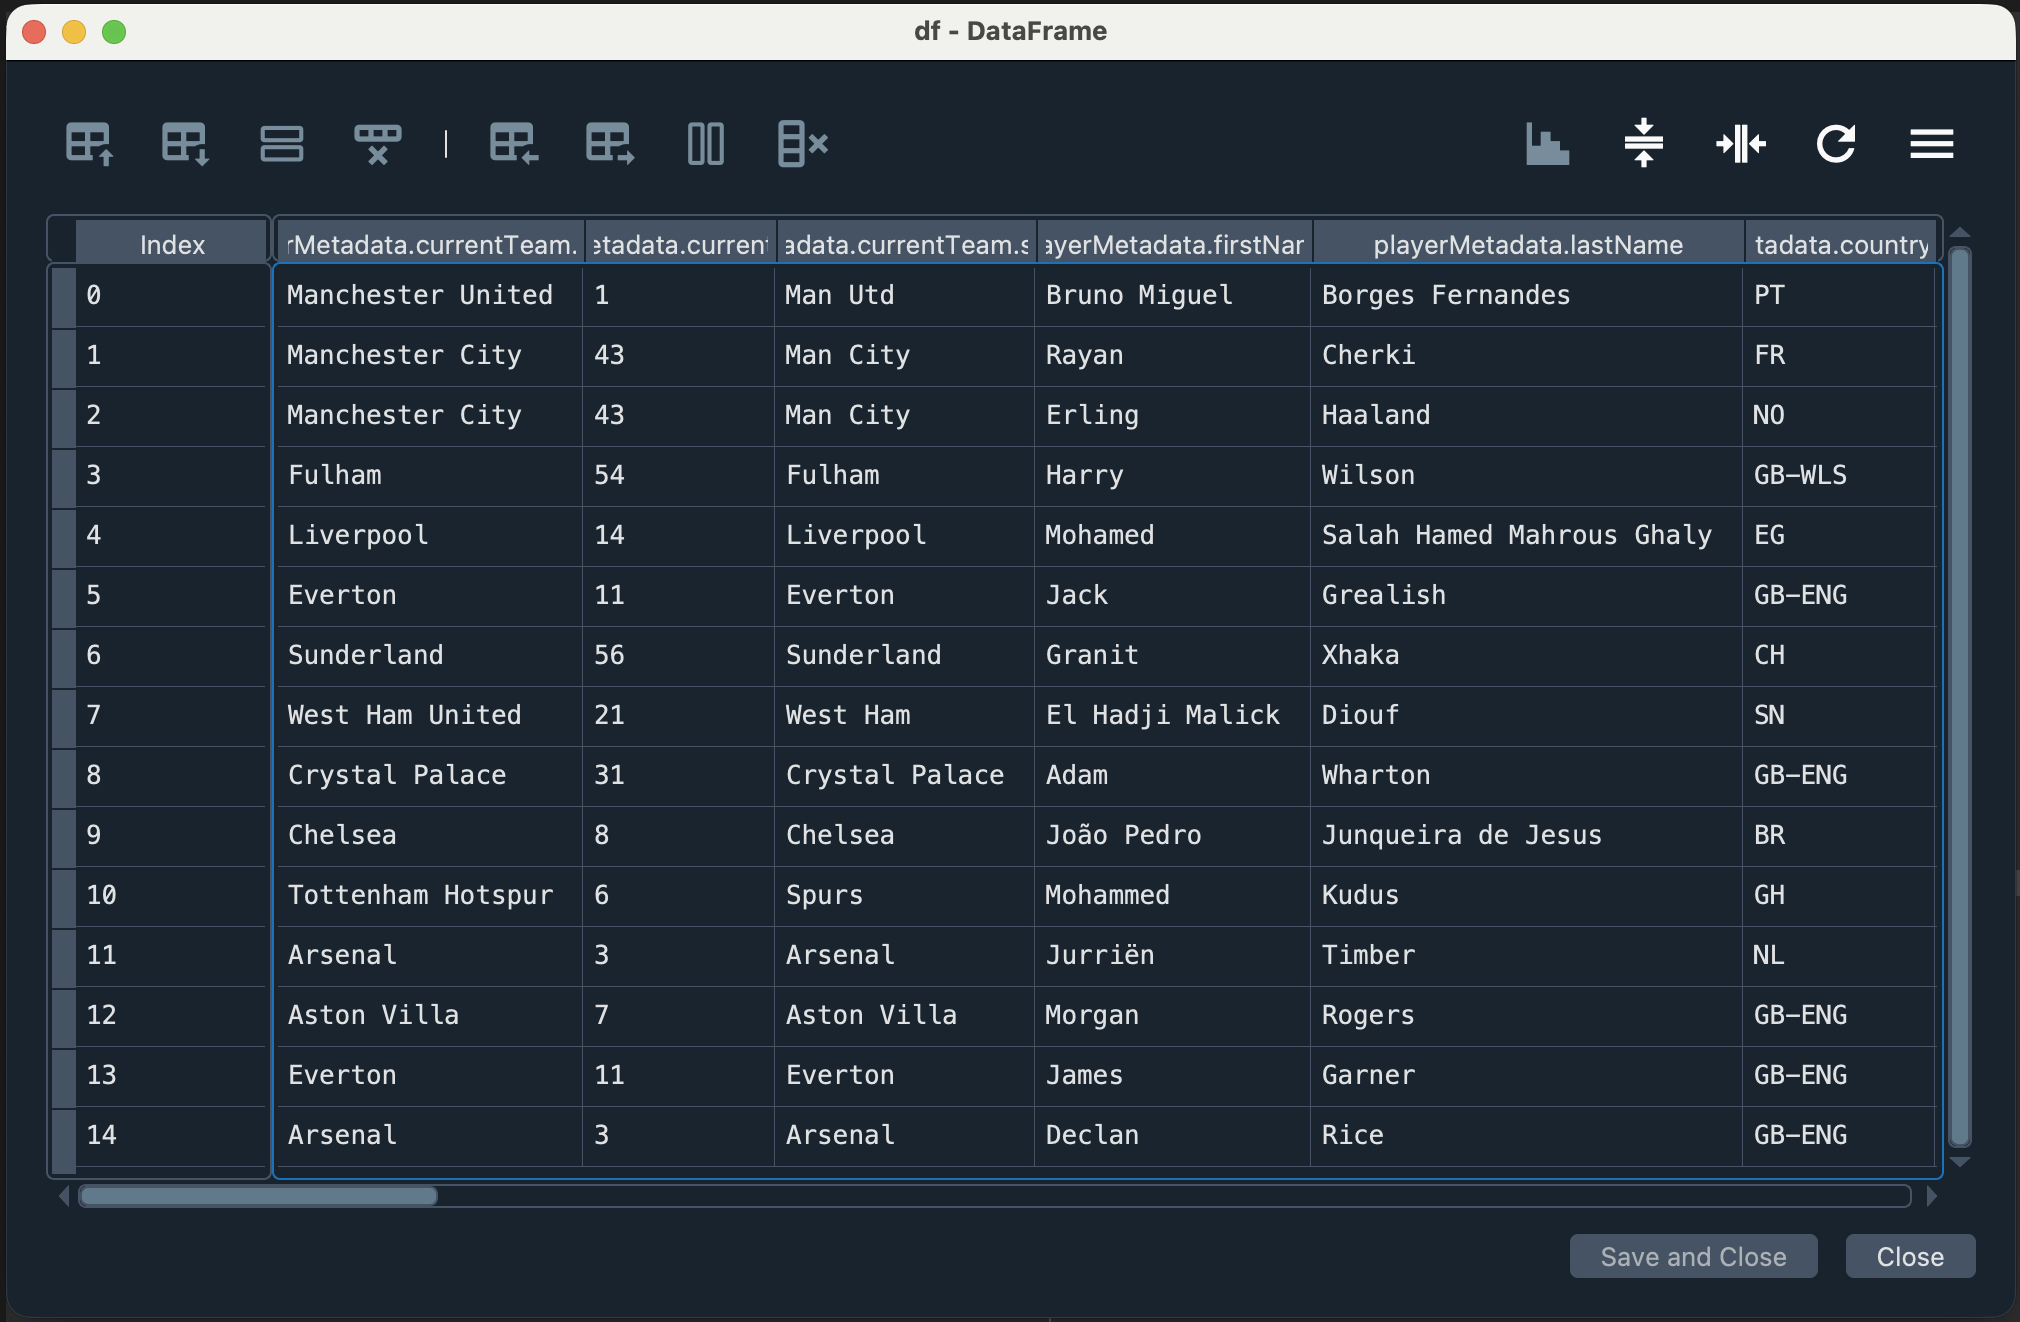
Below is the df DataFrame:
Question 12 (Points: 28)
Write Python code to complete the script below so that it collects data on the top 15 goal scorers for each Premier League season from 2022–2023 through 2025–2026.
Your code should:
- use a for-loop to request the data for each season,
- collect the top 15 goal scorers for each season,
- create one combined pandas DataFrame that includes all four seasons, and
- include a column that identifies the season for each row.
import pandas as pd
import requests
import time, random

headers = {
    'x-pulse-application-version': 'v1.40.15',
    'sec-ch-ua-platform': '"macOS"',
    'Referer': 'https://www.premierleague.com/',
    'User-Agent': 'Mozilla/5.0 (Macintosh; Intel Mac OS X 10_15_7) AppleWebKit/537.36,
    'x-pulse-application-name': 'web',
    'sec-ch-ua': '"Not:A-Brand";v="99", "Google Chrome";v="145", "Chromium";v="145"',
    'sec-ch-ua-mobile': '?0',
}

params = {
    '_sort': 'goal_assists:desc',  # goal_assists:desc   goals:desc
    'country': '',
    '_limit': '15',
}

url = 'https://sdp-prem-prod.premier-league.pulselive.com/api/competitions/8/seasons/'
endpoint = '/players/stats/leaderboard'

# _______________PROVIDE_YOUR_CODE_BELOW_______________
Show answer
df_all = pd.DataFrame()
for yr in range(2022, 2026):
    api_endpoint = url + f'{yr}' + endpoint

    response = requests.get(
        api_endpoint,
        params=params,
        headers=headers,
    )

    # Be polite to the server
    time.sleep(random.uniform(1, 2))

    content = response.json()
    content_data = content['data']
    df = pd.json_normalize(content_data)

    # Include a column that identifies the **season** for each row
    df['season'] = f'{yr}' + '-' f'{yr+1}'

    # Create **one combined pandas DataFrame** that includes all four seasons
    df_all = pd.concat([df_all, df], ignore_index=True)