Midterm Exam II
Spring 2025, DANL 210-01
Descriptive Statistics
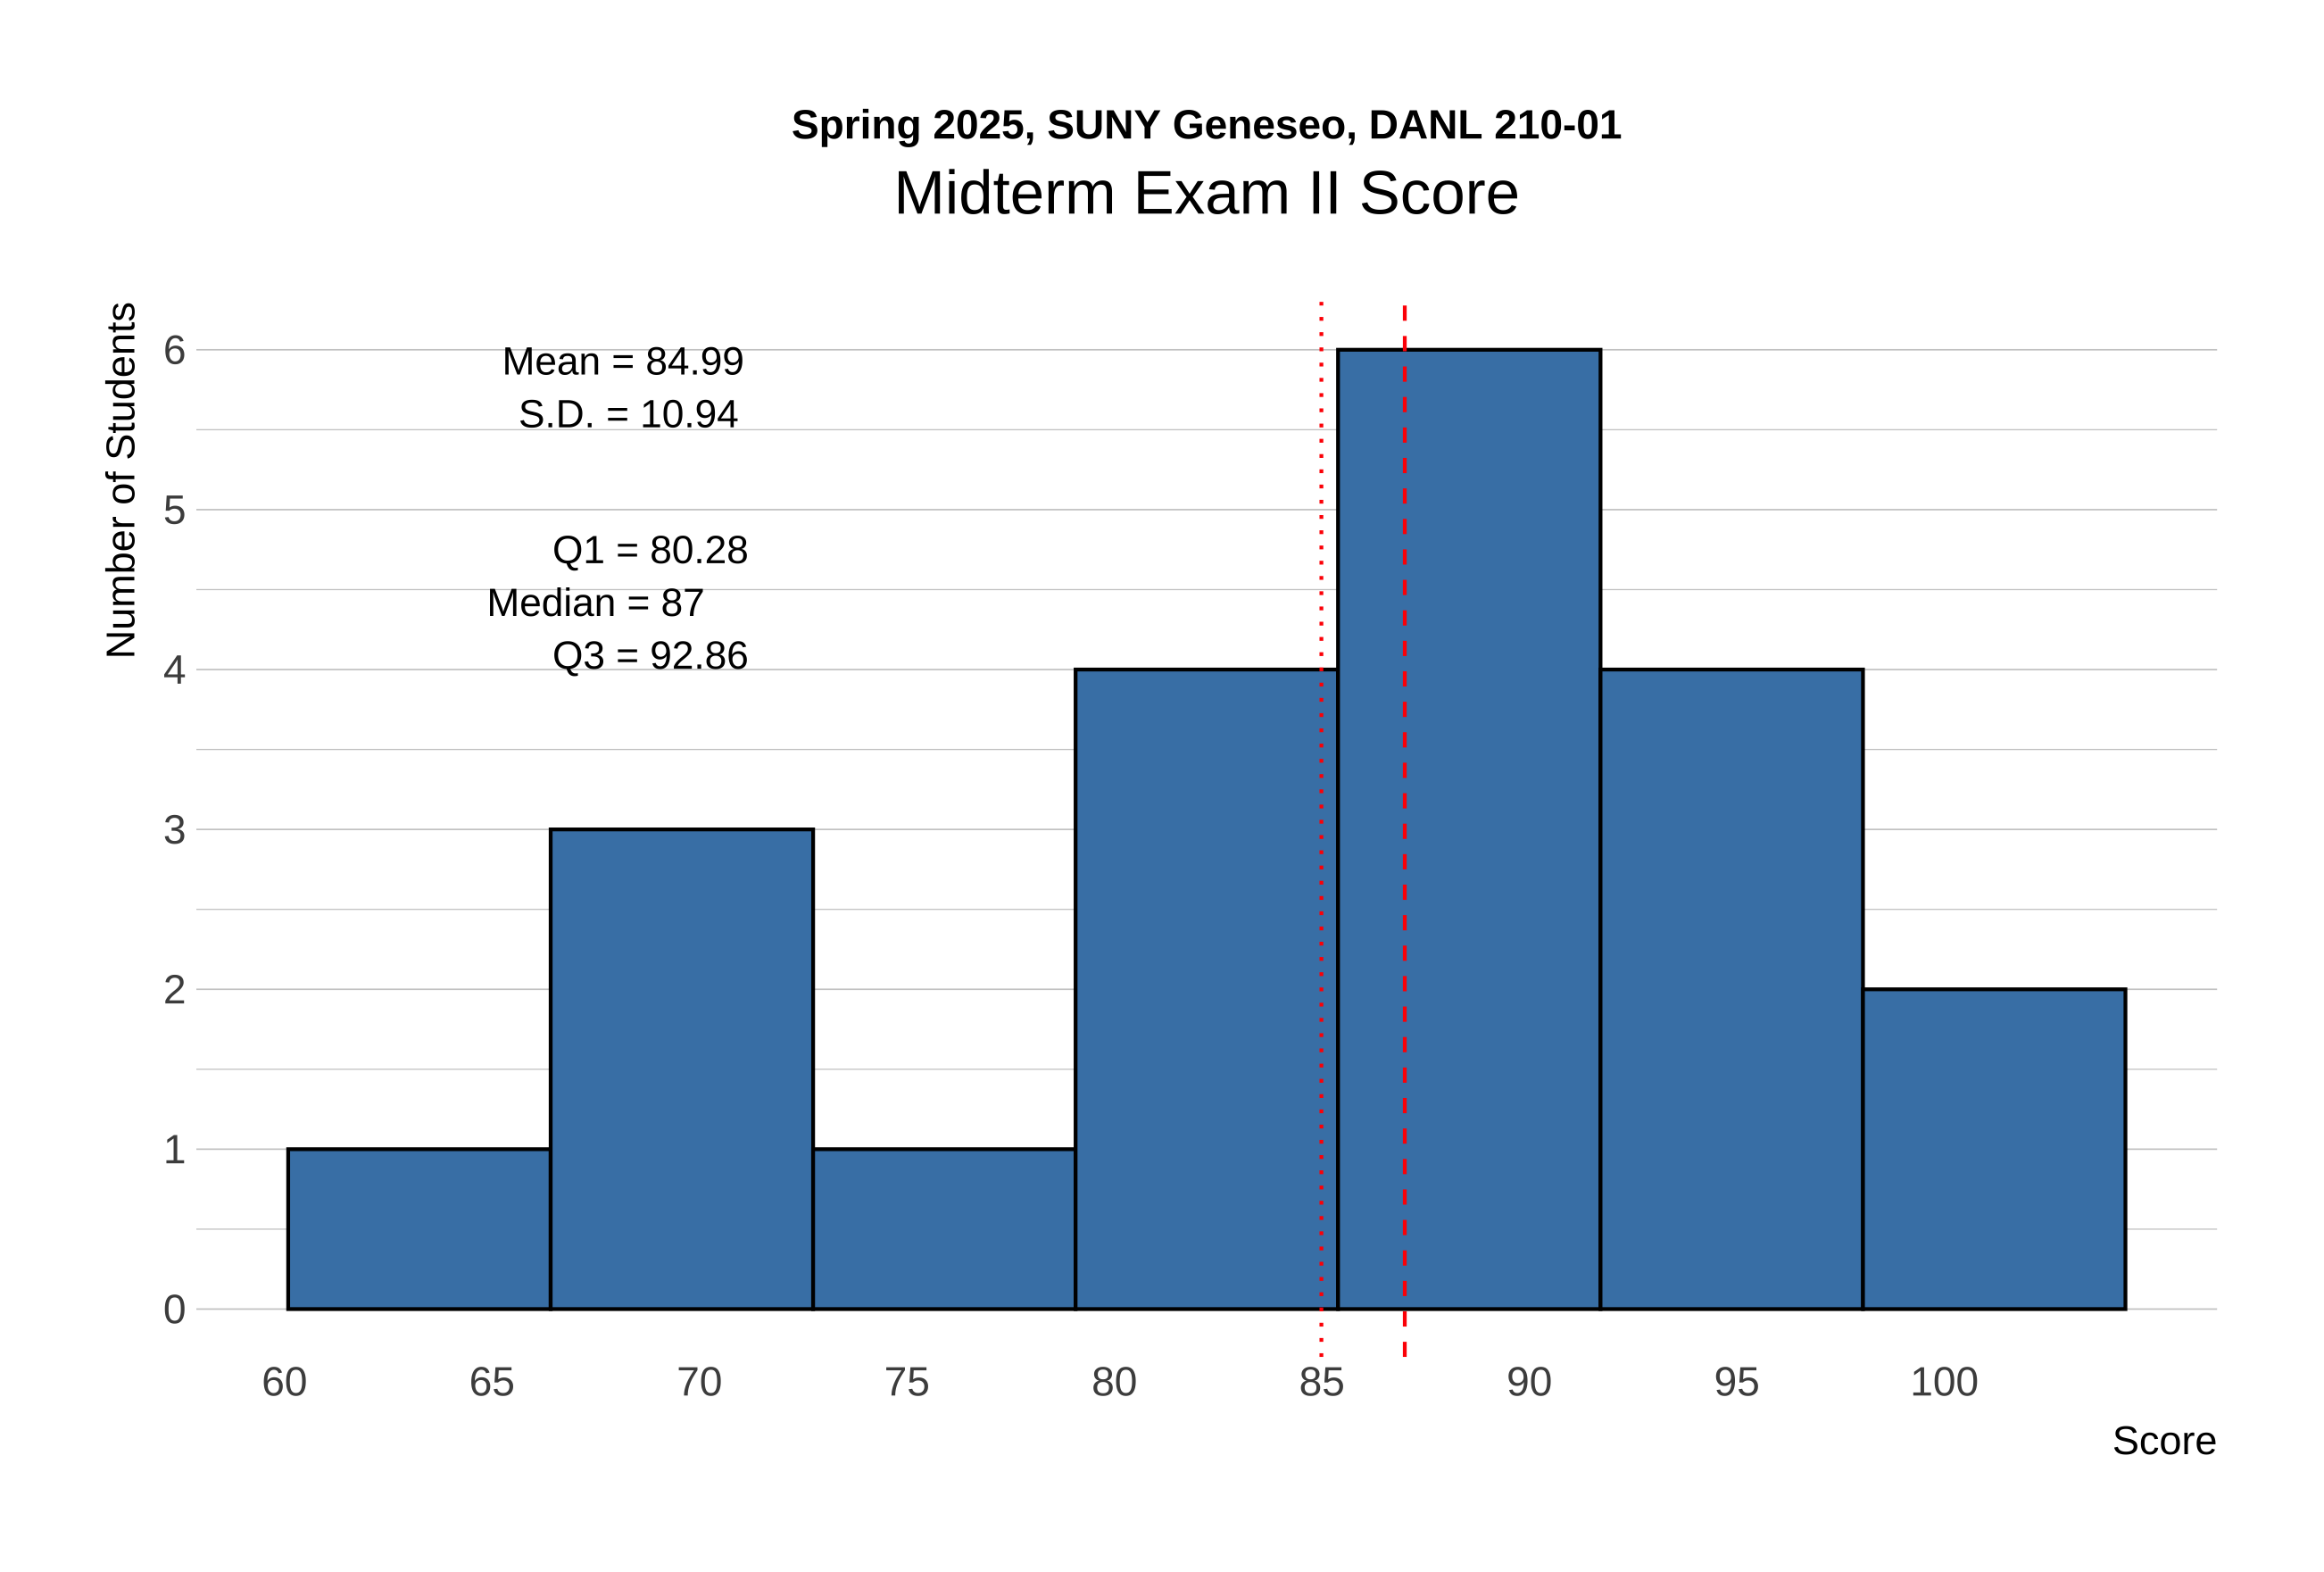
The distribution of scores for Midterm Exam II is shown below:
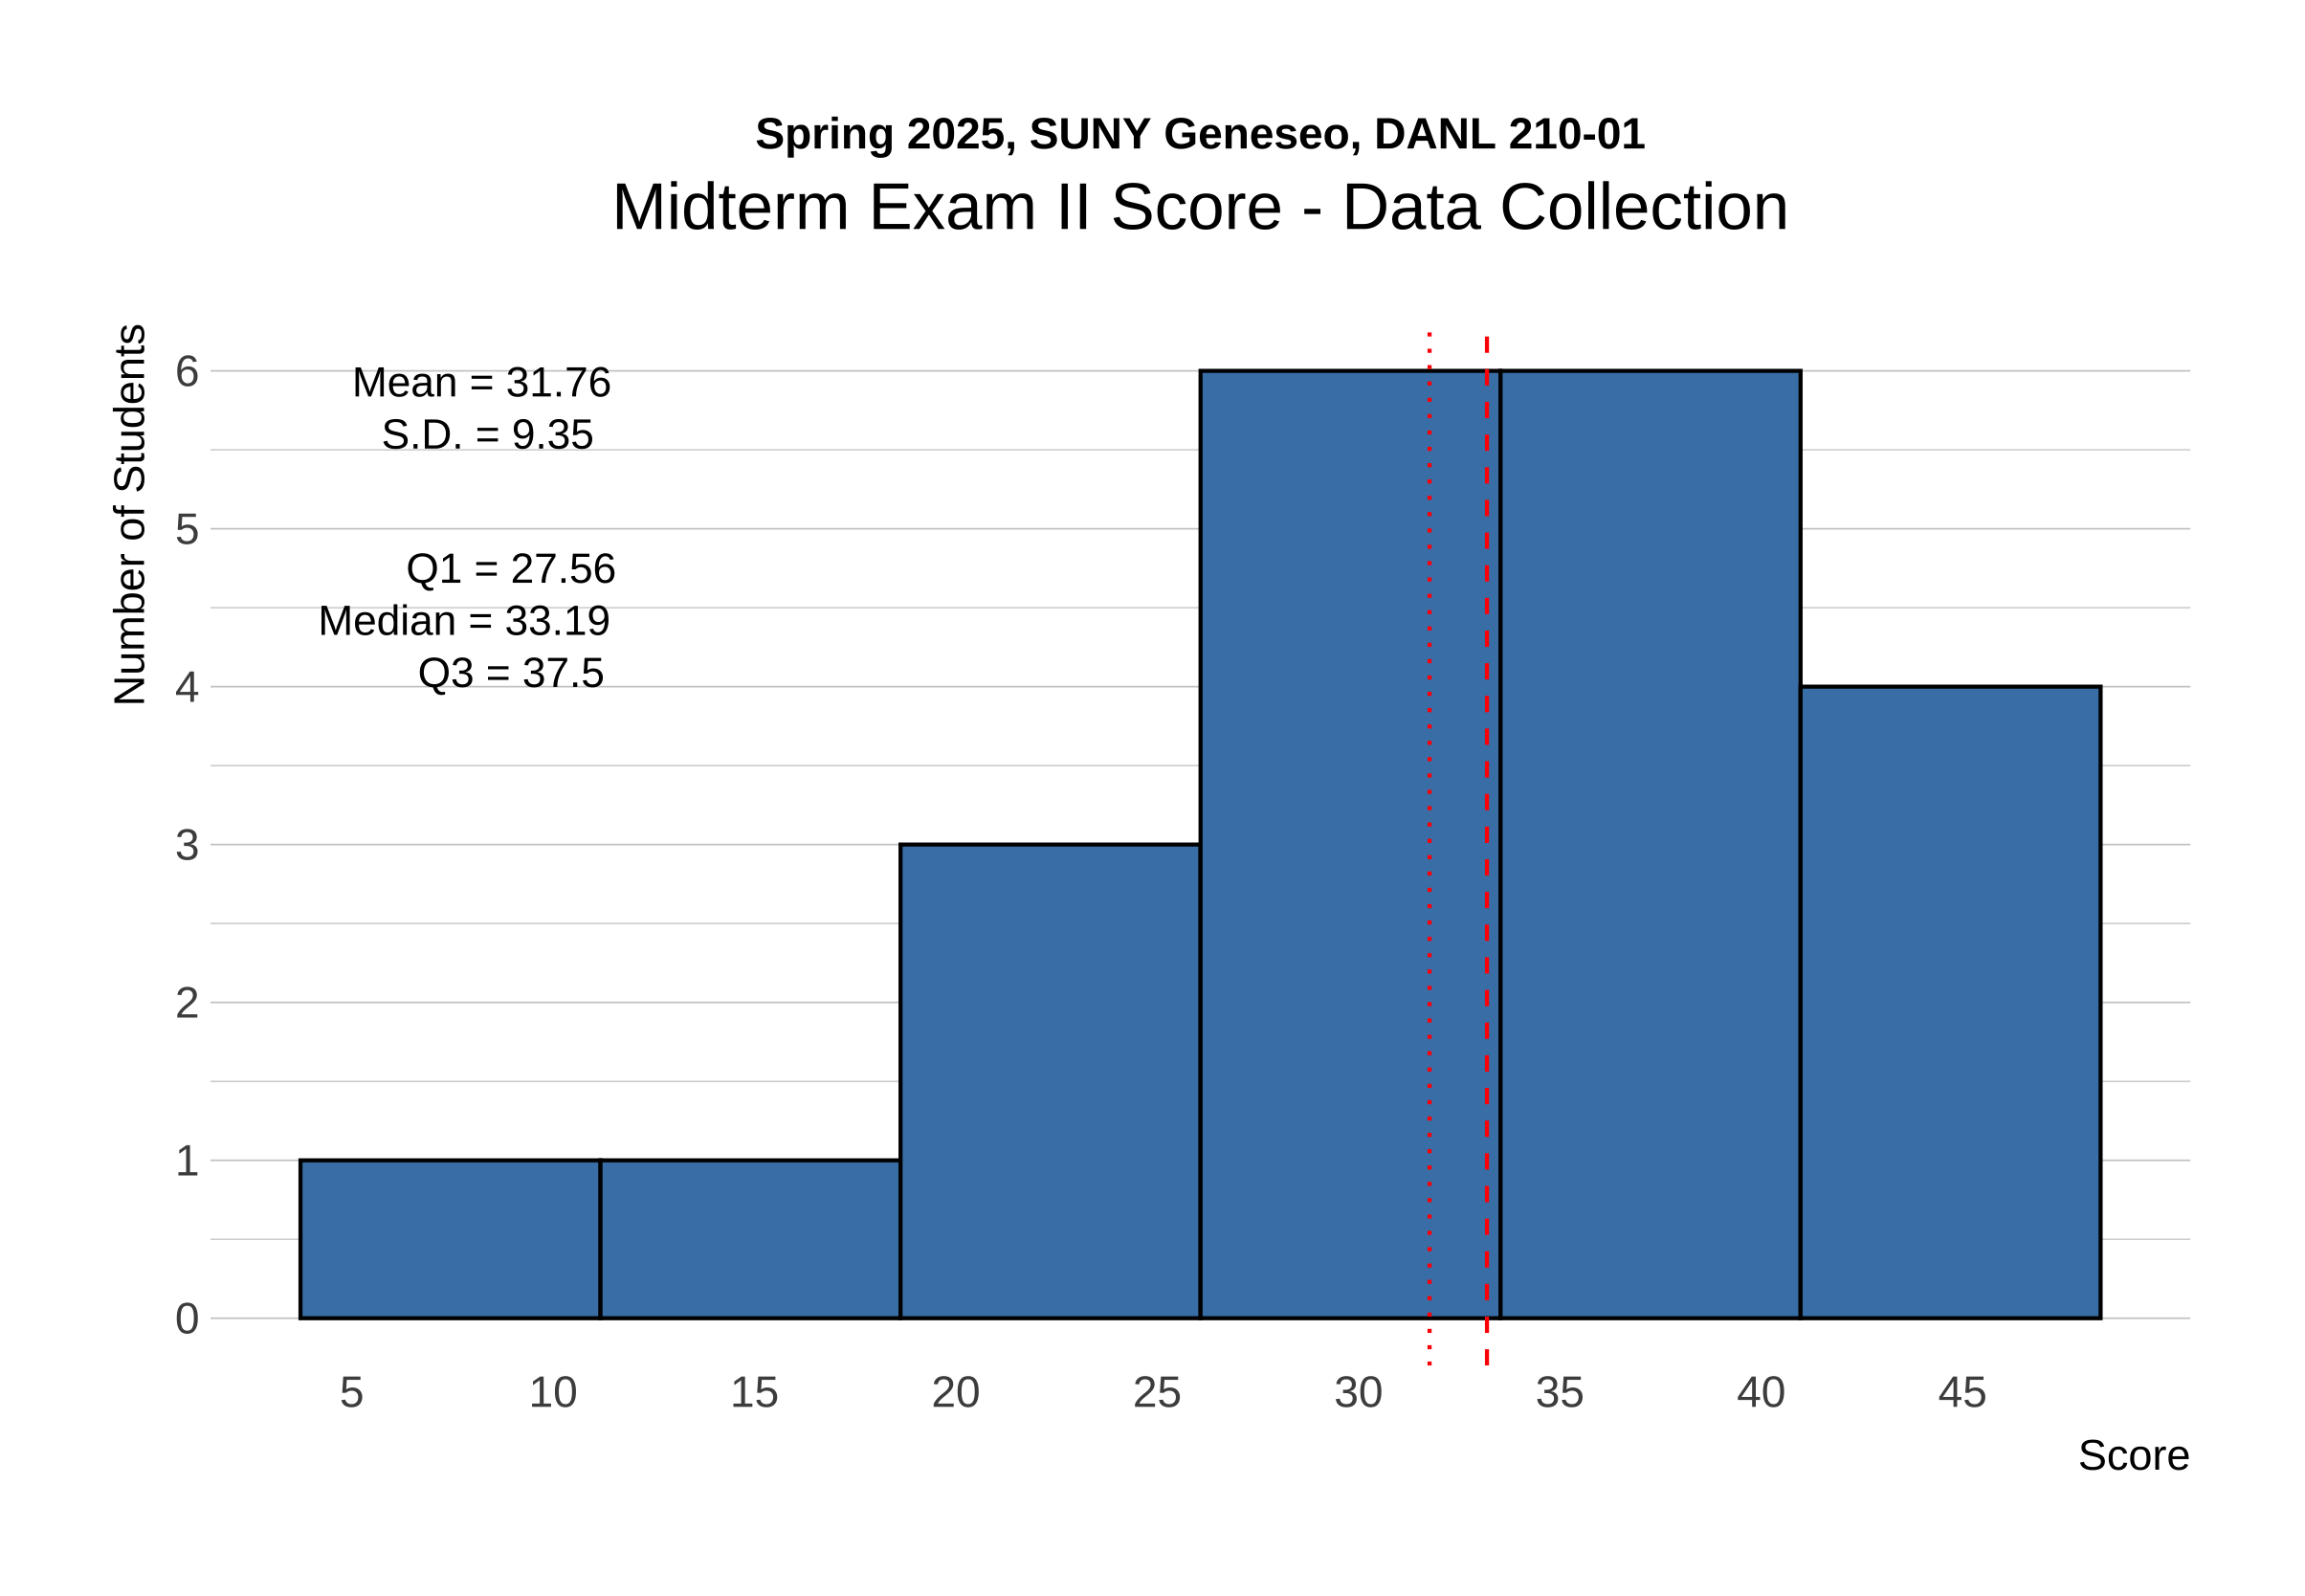
The distribution of raw scores for Data Collection in Midterm Exam II is shown below:
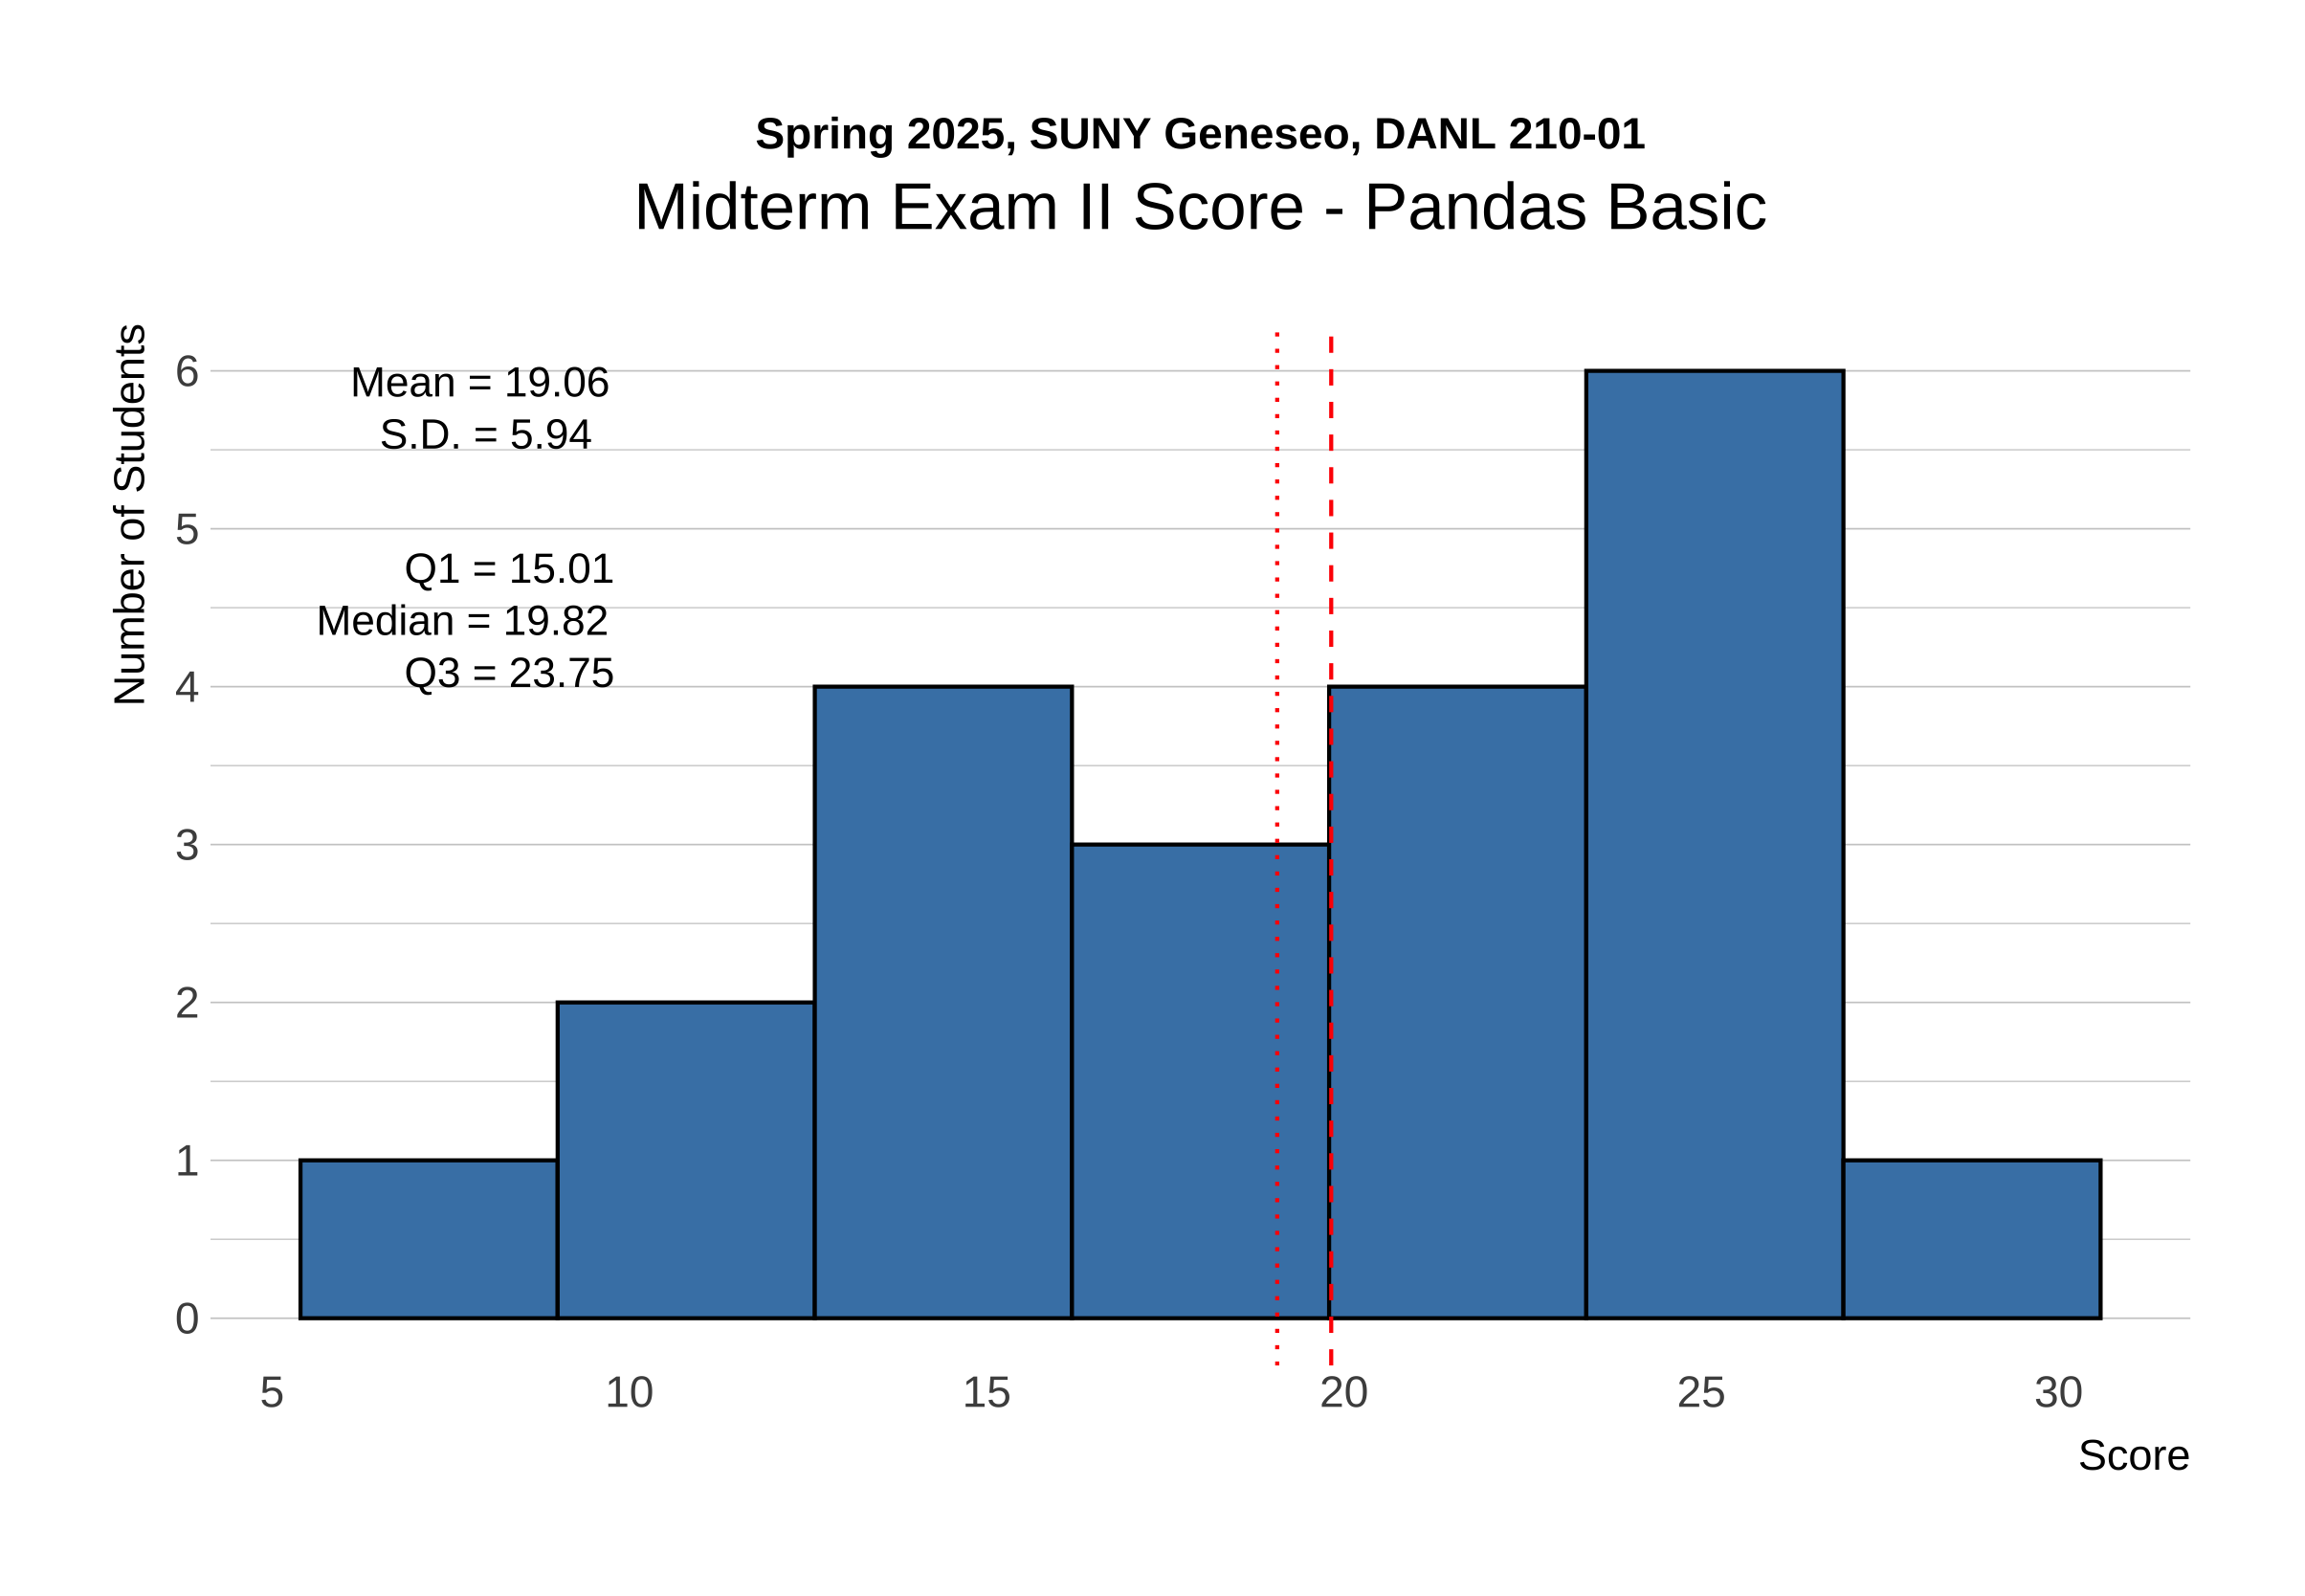
The distribution of raw scores for Pandas in Midterm Exam II is shown below:
The following provides the descriptive statistics for each part of the Midterm Exam II:
Section 1. Data Collection I
# %%
# =============================================================================
# Setting up
# =============================================================================
import pandas as pd
import os
import time
import random
from selenium import webdriver
from selenium.webdriver.common.by import By

driver = webdriver.Chrome()

# Set the working directory path
wd_path = '/Users/bchoe/My Drive/suny-geneseo/spring2025/lecture-code'
os.chdir(wd_path)

url = 'http://quotes.toscrape.com/tableful/'
First/Front page of the website for the url:
Last page of the website for the url:
Corresponding tags
Question 1 (Points: 4)
- Write
pandascode that reads the HTML table from the front page of the website URL stored inurlinto a DataFrame calleddf.
Click to Check the Answer!
df = pd.read_html(url)[0]Question 2 (Points: 4)
- Write code to load the first/front page of the website for the
urlon the Chrome browser that is being controlled by automated test software, calledselenium.
Click to Check the Answer!
driver.get(url)Question 3 (Points: 20)
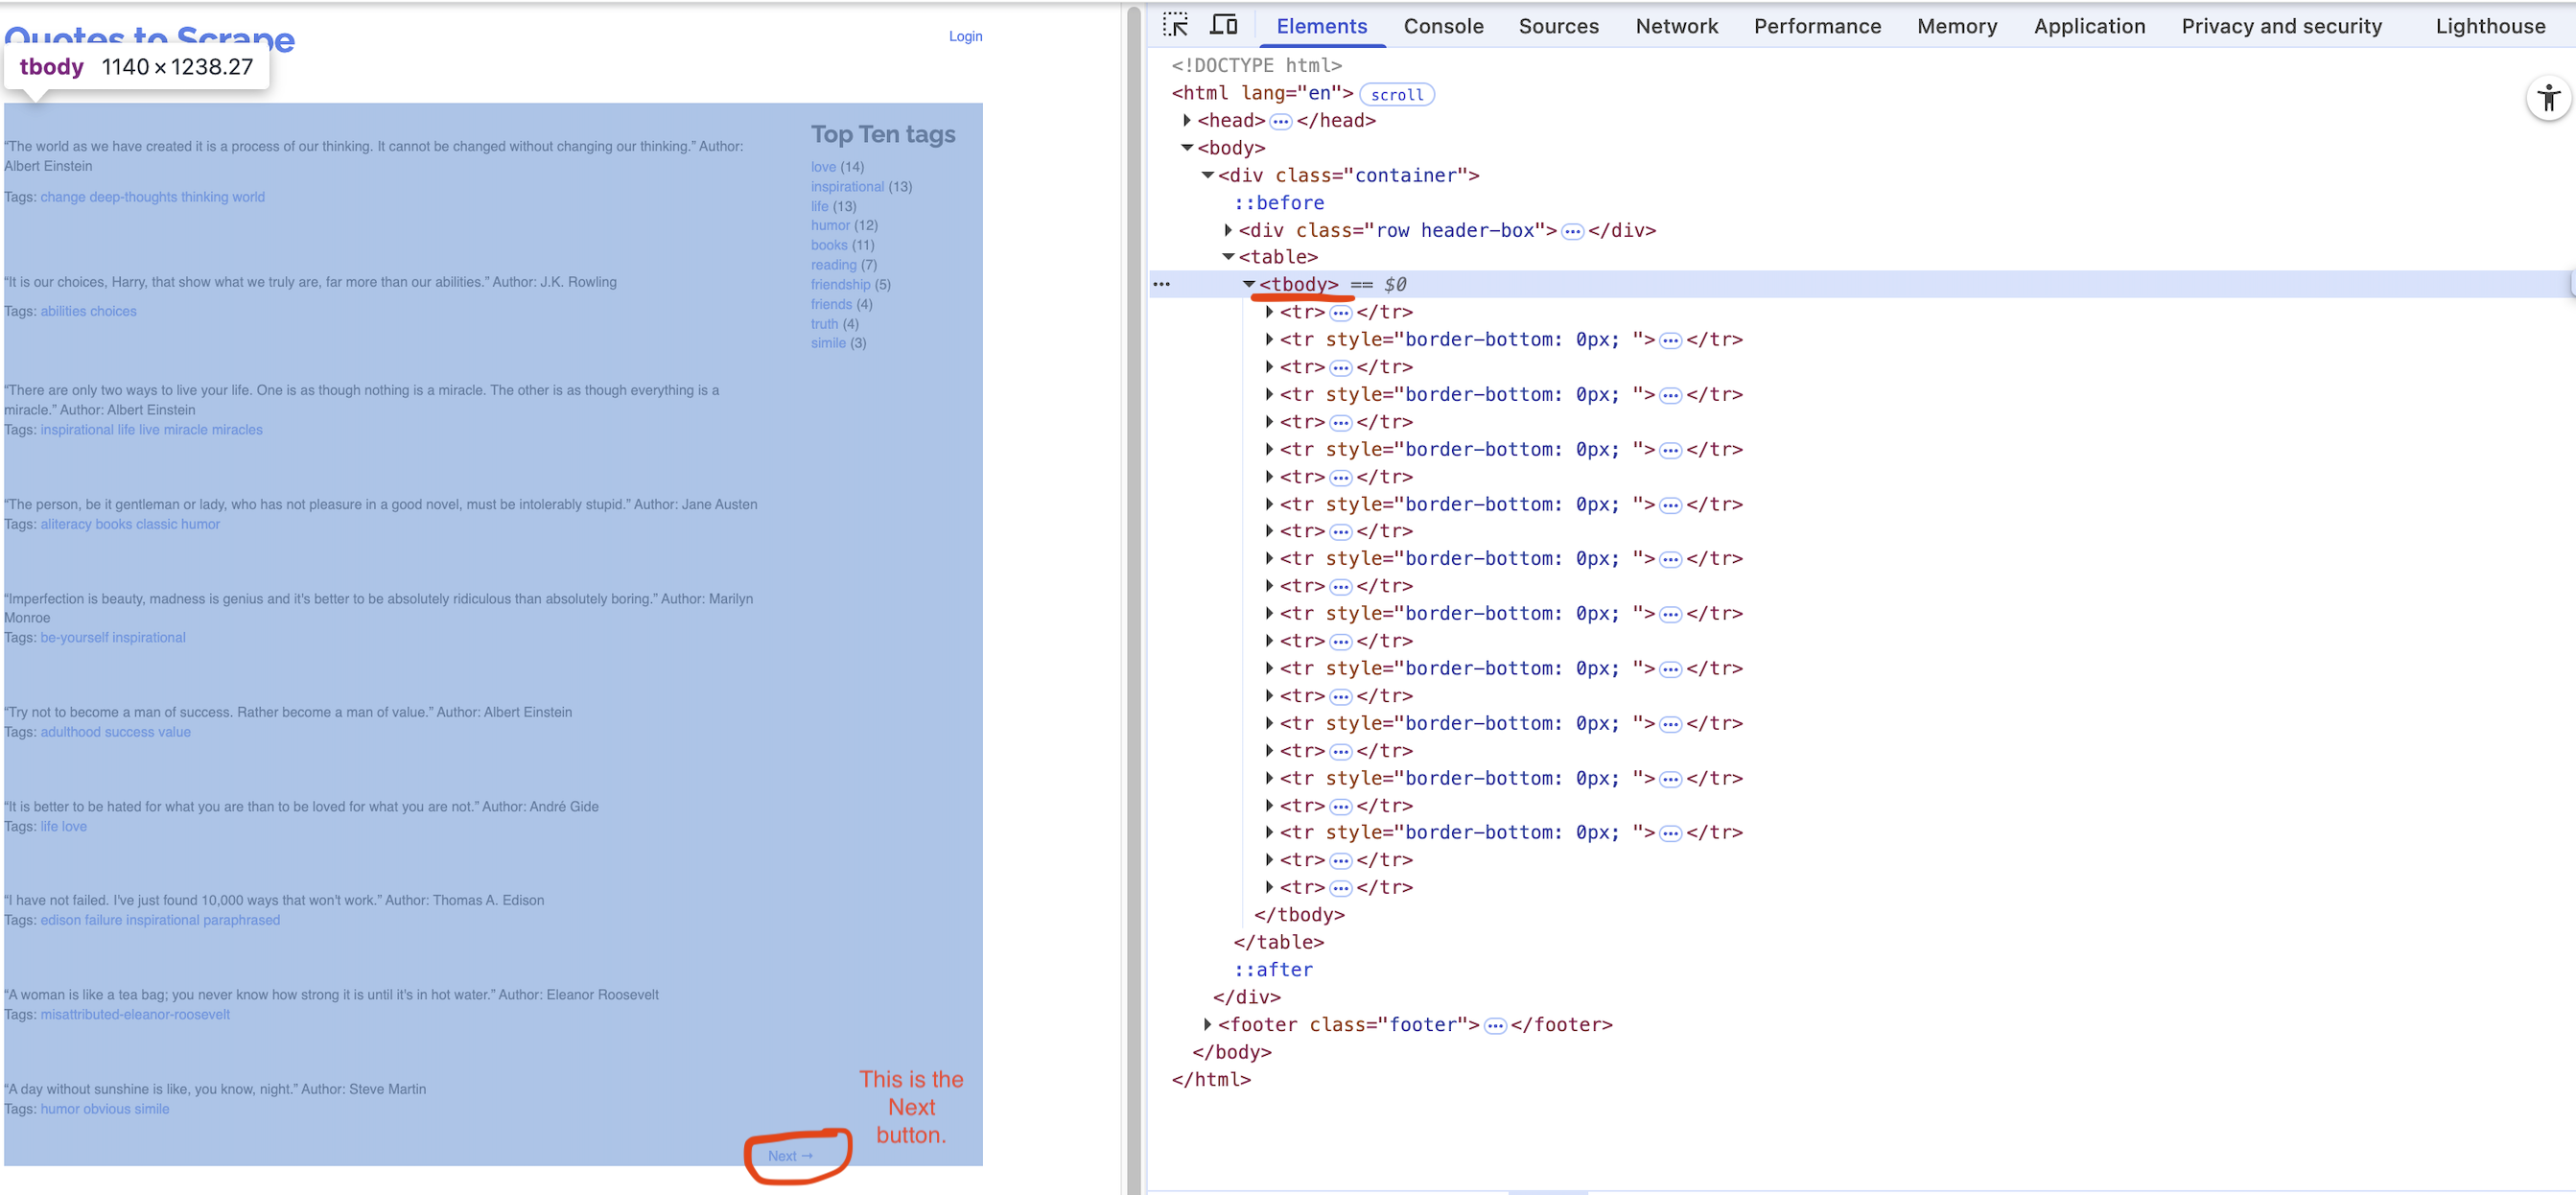
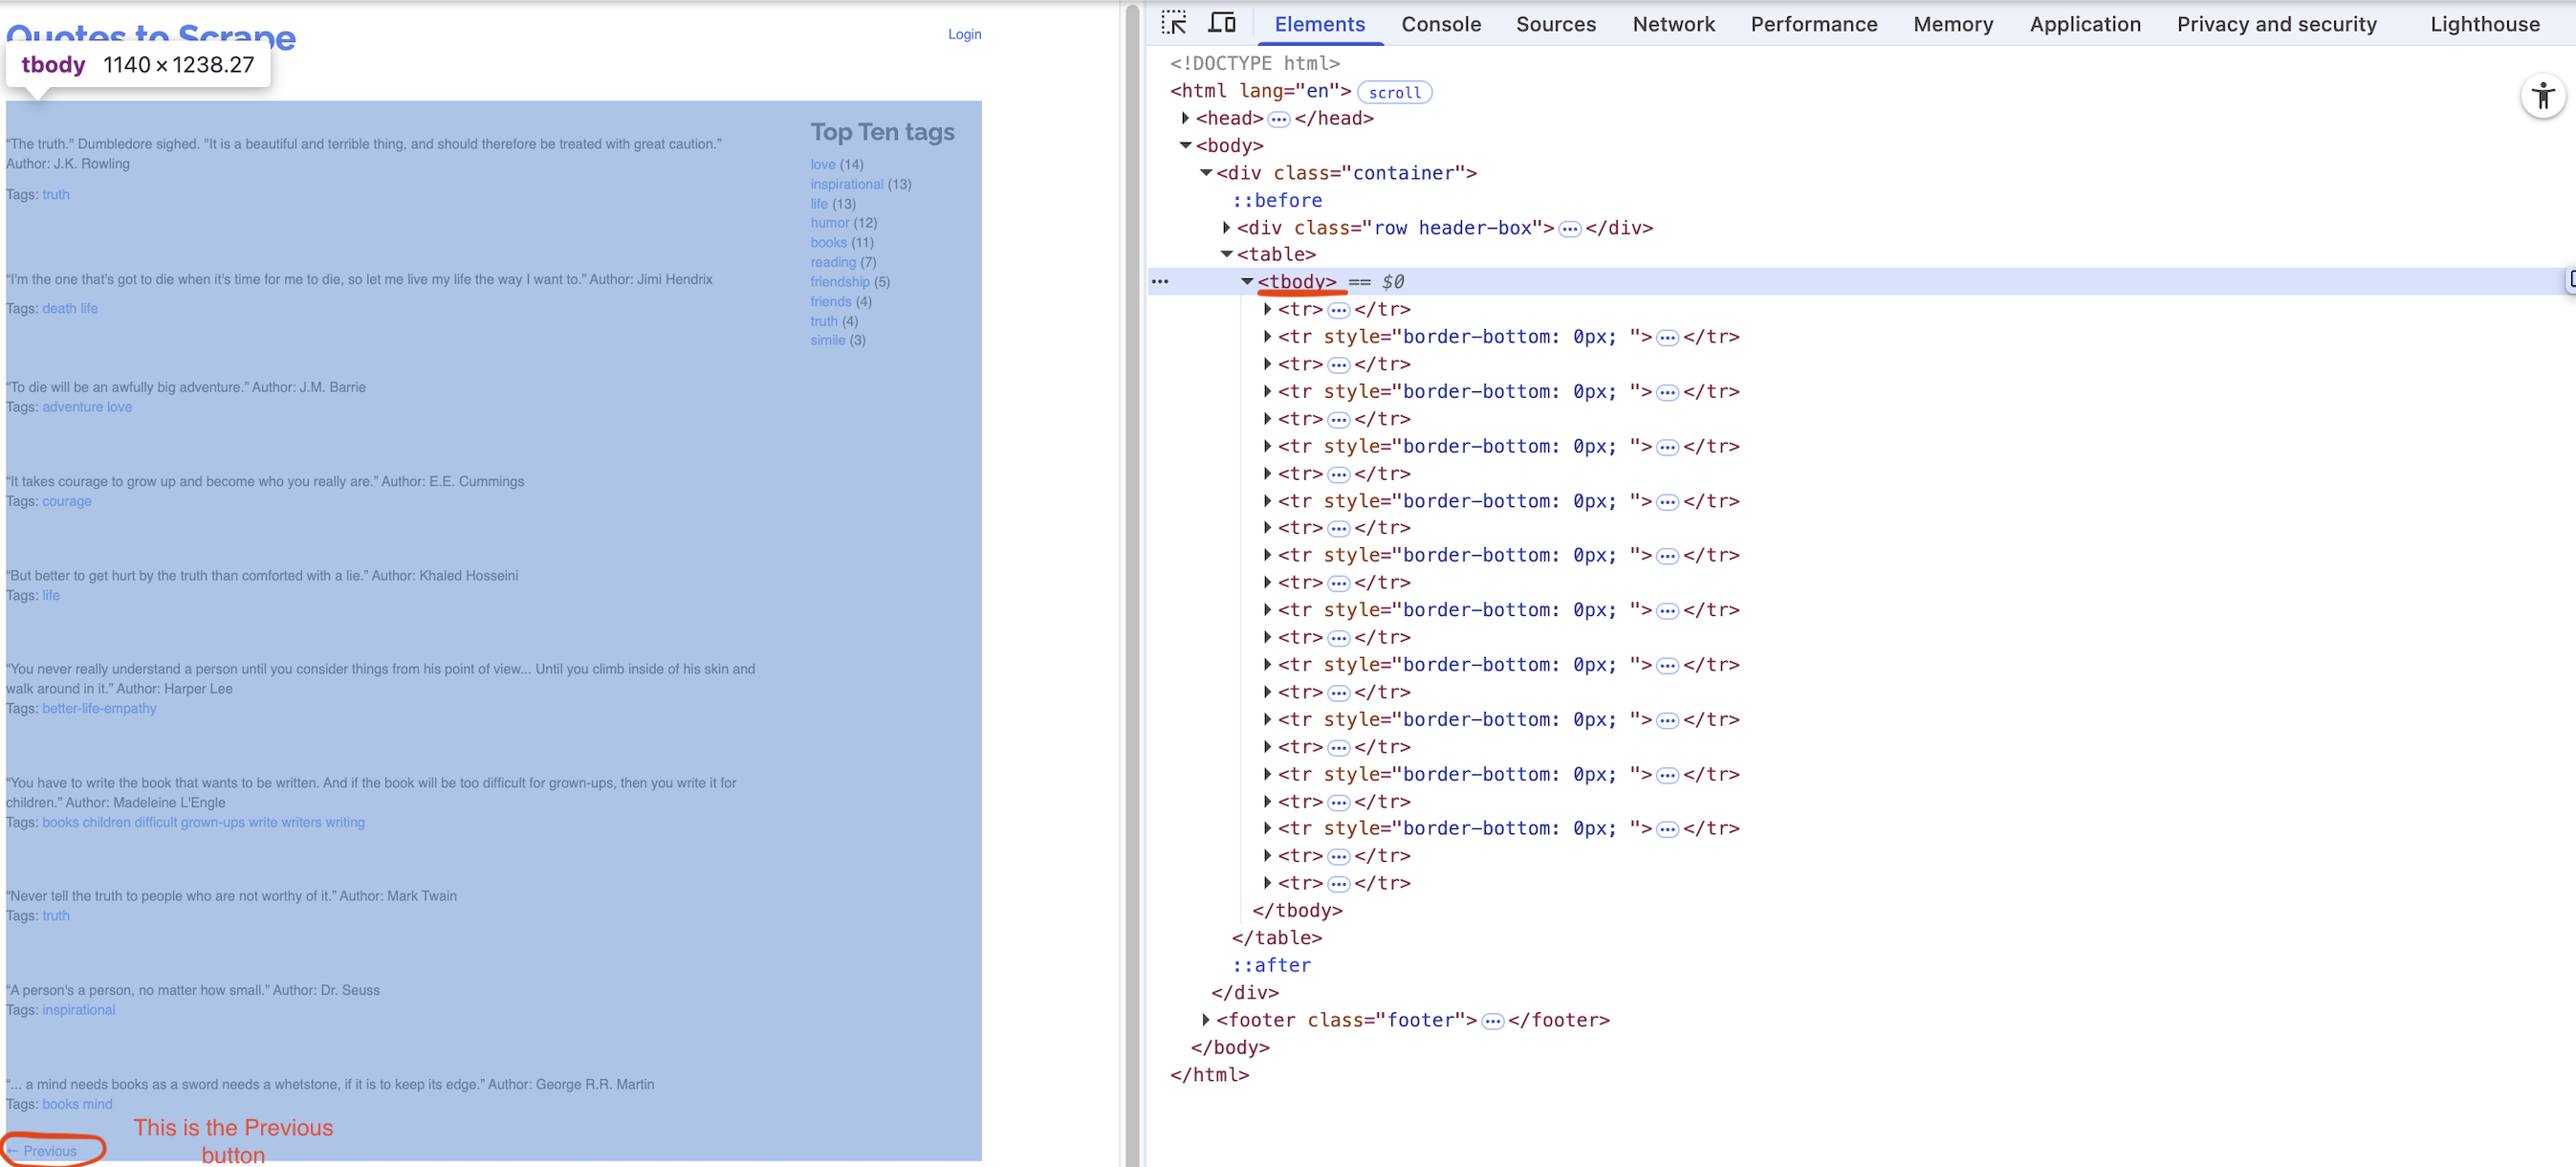
- Write Python code to scrape every quote from a paginated website (unknown number of pages, 10 quotes per page) by repeatedly clicking the Next button until it disappears.
- On each page, extract each quote and its author into a column
quote_authorand its associated tags intotags, appending them to a DataFrame nameddf_clean. - After loading each page, pause execution for a random 1–2 second interval.
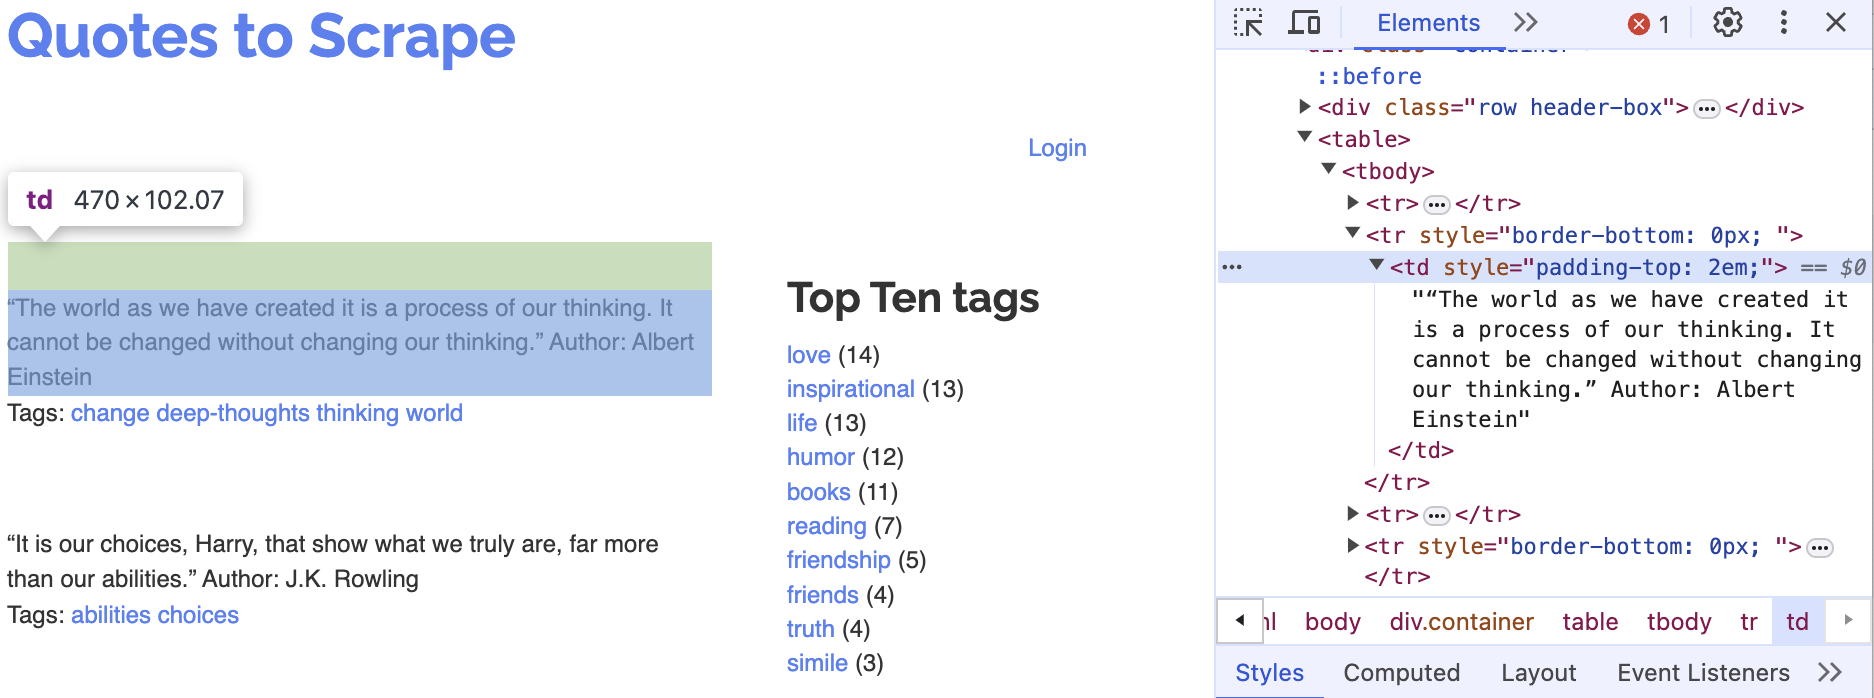
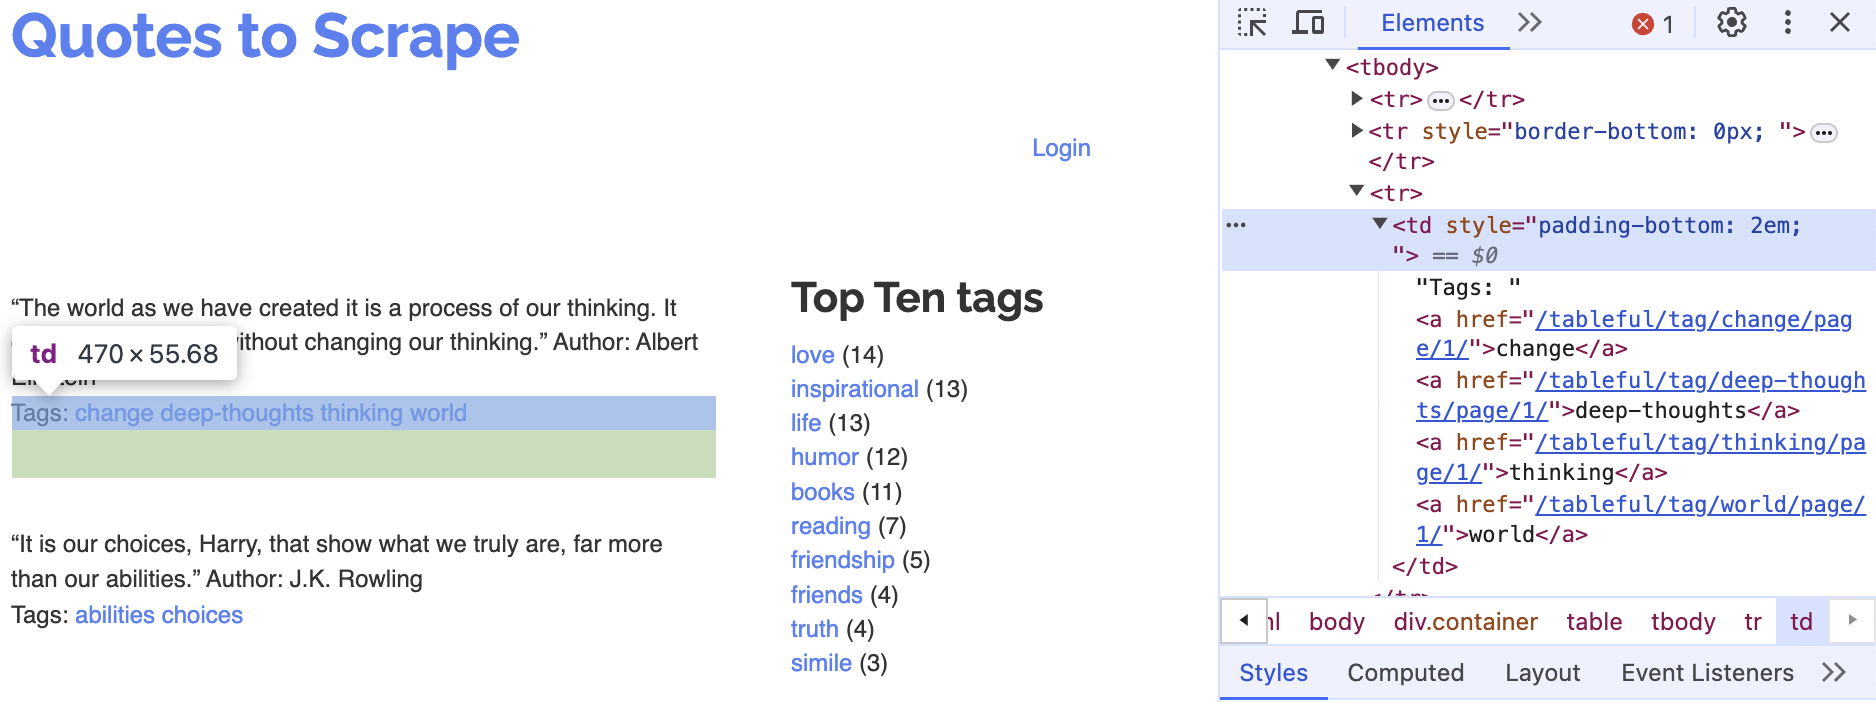
- Examine below XPath examples for
quote_author(rows 2, 4, 6, …) andtags(rows 3, 5, 7, …), identify that pattern of even vs. odd row numbers, and use it to build your f-strings for locating each element.
- On each page, extract each quote and its author into a column
# Table body - quote with author
xpath_quote_author_01 = '/html/body/div/table/tbody/tr[2]/td'
xpath_quote_author_02 = '/html/body/div/table/tbody/tr[4]/td'
xpath_quote_author_03 = '/html/body/div/table/tbody/tr[6]/td'
xpath_quote_author_04 = '/html/body/div/table/tbody/tr[8]/td'
xpath_quote_author_05 = '/html/body/div/table/tbody/tr[10]/td'
xpath_quote_author_06 = '/html/body/div/table/tbody/tr[12]/td'
xpath_quote_author_07 = '/html/body/div/table/tbody/tr[14]/td'
xpath_quote_author_08 = '/html/body/div/table/tbody/tr[16]/td'
xpath_quote_author_09 = '/html/body/div/table/tbody/tr[18]/td'
xpath_quote_author_10 = '/html/body/div/table/tbody/tr[20]/td'

# Table body - tags
xpath_tags_01 = '/html/body/div/table/tbody/tr[3]/td'
xpath_tags_02 = '/html/body/div/table/tbody/tr[5]/td'
xpath_tags_03 = '/html/body/div/table/tbody/tr[7]/td'
xpath_tags_04 = '/html/body/div/table/tbody/tr[9]/td'
xpath_tags_05 = '/html/body/div/table/tbody/tr[11]/td'
xpath_tags_06 = '/html/body/div/table/tbody/tr[13]/td'
xpath_tags_07 = '/html/body/div/table/tbody/tr[15]/td'
xpath_tags_08 = '/html/body/div/table/tbody/tr[17]/td'
xpath_tags_09 = '/html/body/div/table/tbody/tr[19]/td'
xpath_tags_10 = '/html/body/div/table/tbody/tr[21]/td'
Click to Check the Answer!
df_clean = pd.DataFrame()
while True:

    try:
        btn = driver.find_element(By.PARTIAL_LINK_TEXT, "Next")
    except:
        btn = []

    for i in range(1,11):
        j = i*2
        k = i*2+1

        xpath_quote_author = f'/html/body/div/table/tbody/tr[{j}]/td'
        xpath_tags = f'/html/body/div/table/tbody/tr[{k}]/td'

        quote_author = driver.find_element(By.XPATH, xpath_quote_author).text
        tags = driver.find_element(By.XPATH, xpath_tags).text

        lst = [quote_author, tags]
        obs = pd.DataFrame([lst])
        df_clean = pd.concat([df_clean, obs])

    if btn != []:
        btn.click()
        time.sleep(random.uniform(1,2))
    else:
        break

df_clean.columns = ['quote_author', 'tags']
Question 4 (Points: 4)
- Write one-line code to export the
df_cleanDataFrame as a CSV file named table_quotes.csv inside the data subfolder of the current working directory given bywd_path.- Ensure that the CSV does not include row index of the
df_cleanDataFrame.
- Ensure that the CSV does not include row index of the
Click to Check the Answer!
df_clean.to_csv('data/quotes_table.csv', index=False, encoding = 'utf-8-sig') Question 5 (Points: 4)
- Write a one-line code to quit the Chrome browser that is being controlled by automated test software, called
selenium.
Click to Check the Answer!
driver.quit()Section 2. Data Collection II
Question 6 (Points: 4)
- In the client–server model of the web, which statement is true?
- A client hosts webpages, and a server displays them to users.
- A client requests data, and a server responds with data.
- Clients and servers are the same machine communicating via HTTPS.
- A server initiates requests, and a client responds with data.
Click to Check the Answer!
b. A client requests data, and a server responds with data.Question 7 (Points: 10)
- Fill in the following 5 blanks to make a request to the FRED API for collecting the U.S. unemployment rate (
series_id= “UNRATE”)
import requests
import pandas as pd
param_dicts = {
'api_key': 'YOUR_FRED_API_KEY', ## Change to your own key
'file_type': 'json',
'series_id': ___BLANK_1___ ## ID for series data from the FRED
}
api_endpoint = "https://api.stlouisfed.org/fred/series/observations"
response = ___BLANK_2___
# Check if the server successfully sends the requested content
if ___BLANK_3___:
# Convert JSON response to Python dictionary.
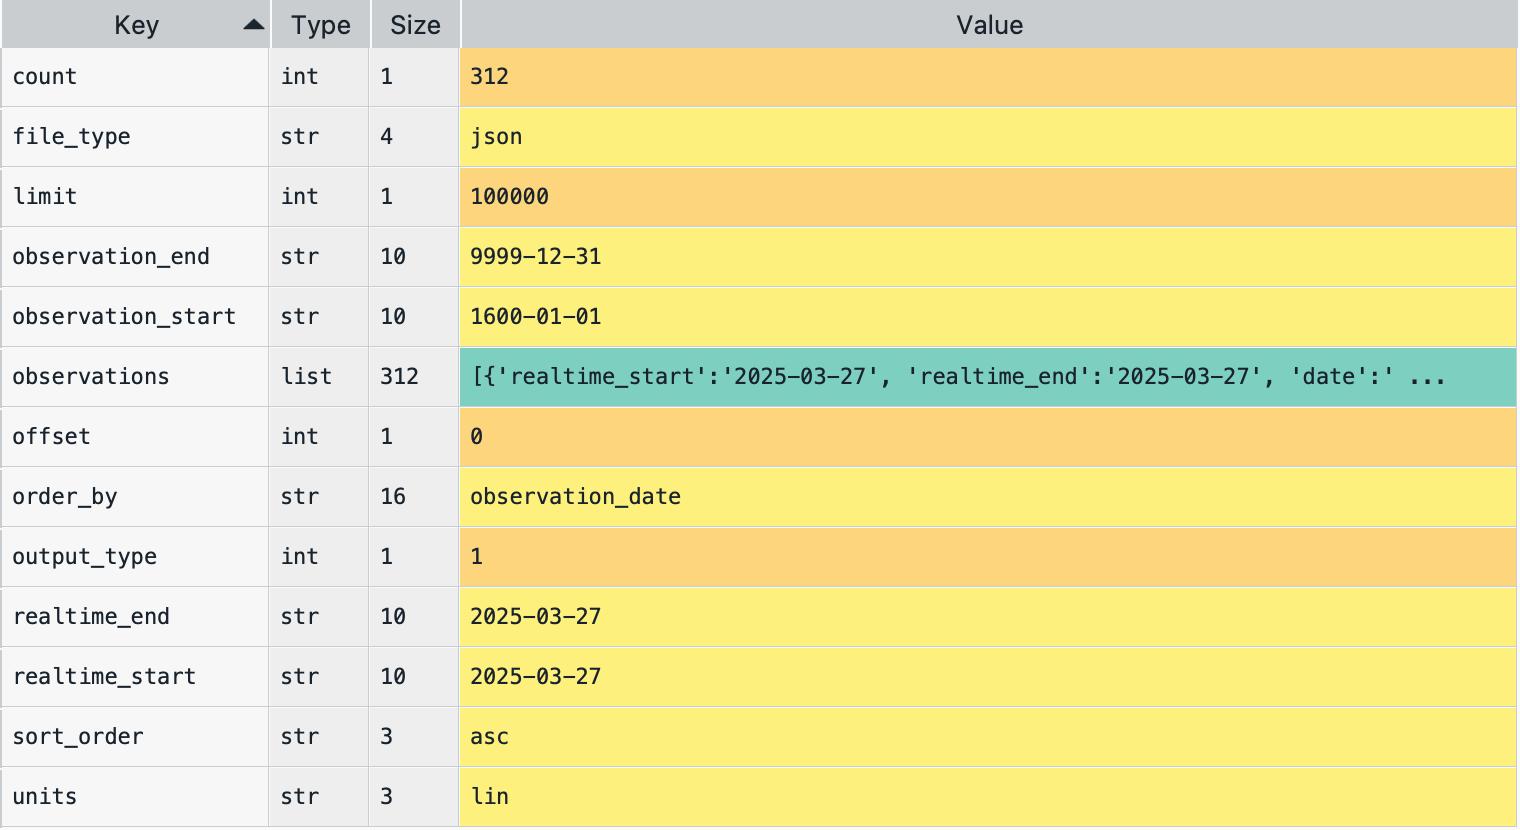
content = ___BLANK_4___
# Create a DataFrame of key 'observations's value from the content dictionary
df = pd.DataFrame( ___BLANK_5___ )
else:
print("The server cannot find the requested content")key-value pairs in the content dictionary
Answer for ___BLANK_1___:
Click to Check the Answer!
"UNRATE"Answer for ___BLANK_2___:
Click to Check the Answer!
requests.get(api_endpoint, params=param_dicts)Answer for ___BLANK_3___:
Click to Check the Answer!
response.status_code == 200Answer for ___BLANK_4___:
Click to Check the Answer!
response.json()Answer for ___BLANK_5___:
Click to Check the Answer!
content['observations']Section 3. Pandas Basics I
import pandas as pd
import numpy as np
Below is spotify DataFrame that reads the file spotify_all.csv containing data of Spotify users’ playlist information (Source: Spotify Million Playlist Dataset Challenge).
spotify = pd.read_csv('https://bcdanl.github.io/data/spotify_all.csv')Variable Description
pid: playlist ID; unique ID for playlistplaylist_name: a name of playlistpos: a position of the track within a playlist (starting from 0)artist_name: name of the track’s primary artisttrack_name: name of the trackduration_ms: duration of the track in milliseconds
Definition of a Song
In Section 1, a song is defined as a combination of a
artist_namevalue and atrack_namevalue.E.g., the following provides the 12 distinct songs with the same
track_name—I Love You:
| Index | artist_name | track_name |
|---|---|---|
| 0 | Alex & Sierra | I Love You |
| 1 | Alex Clare | I Love You |
| 2 | Axwell /\ Ingrosso | I Love You |
| 3 | Beat Happening | I Love You |
| 4 | Climax Blues Band | I Love You |
| 5 | Céline Dion | I Love You |
| 6 | Donna Summer | I Love You |
| 7 | Eli Young Band | I Love You |
| 8 | Faith Evans | I Love You |
| 9 | Mary J. Blige | I Love You |
| 10 | OMFG | I Love You |
| 11 | Said The Whale | I Love You |
Question 8 (Points: 4)
- Complete the following line so that
num_columnsis assigned the total number of columns in thespotifyDataFrame as an integer:
num_columns = spotify._______________________________________________Click to Check the Answer!
num_columns = spotify.shape[1]Question 9 (Points: 4)
- Write code to count how many tracks each playlist contains.
Click to Check the Answer!
spotify[['pid', 'playlist_name']].value_counts().reset_index()Question 10 (Points: 5)
- Write code to identify playlists that include at least 100 different artists.
Click to Check the Answer!
plist_100 = (
 spotify[['pid', 'playlist_name', 'artist_name']]
 .drop_duplicates()
 .value_counts()
 .reset_index()[['pid', 'playlist_name']]
 .value_counts()
 .reset_index()
 .query('count >= 100')
 )
Question 11 (Points: 5)
- Write code to calculate the proportion of playlists in
spotifythat contain at least one duplicated song, i.e. (the number of playlists with at least 1 duplicate song) divided by (the total number of distinct playlists)
Click to Check the Answer!
dup_T = spotify.duplicated(subset=["pid", "artist_name", "track_name"])
duplicate_plist = (
    spotify[ dup_T ]
    .drop_duplicates(subset = ['pid', 'playlist_name'])
    )


all_plists = (
    spotify
    .drop_duplicates(subset = ['pid', 'playlist_name'])
    )

duplicate_plist.shape[0] / all_plist.shape[0]
Question 12 (Points: 6)
- Write code to add a new column,
duration_cat, to thespotifyDataFrame that categorizesduration_msinto:- “short” for tracks under 3 minutes (<180000 ms)
- “medium” for tracks between 3 and 5 minutes (180000–300000 ms)
- “long” for tracks over 5 minutes (>300000 ms)
Click to Check the Answer!
spotify['duration_cat'] = np.where(spotify['duration_ms'] < 180*1000,
                                   "short",
                                   "")

spotify['duration_cat'] = np.where(spotify['duration_ms'] > 300*1000,
                                   "long",
                                   spotify['duration_cat'])

spotify['duration_cat'] = np.where(spotify['duration_cat'] == '',
                                   "medium",
                                   spotify['duration_cat'])
Question 13 (Points: 7)
- Write code to find the second most frequently appearing song(s) across all playlists that include “Viva La Vida” (
track_name) by “Coldplay” (artist_name).
Click to Check the Answer!
coldplay_list = (
    spotify.query('artist_name == "Coldplay" & track_name == "Viva La Vida"')
    )

after_coldplay = (
    spotify[ spotify['pid'].isin(coldplay_list['pid']) ]
    [ ['artist_name', 'track_name'] ]
    .value_counts()
    .reset_index()
    .nlargest(2, 'count', keep="all")
    )
Question 14 (Points: 7)
- Consider a DataFrame called
songs, derived fromspotify, that adds a new variablesongby concatenating each row’sartist_nameandtrack_name:
| Index | pid | playlist_name | song |
|---|---|---|---|
| 0 | 0 | Throwbacks | Missy Elliott - Lose Control (feat. Ciara & Fat Man Scoop) |
| 1 | 0 | Throwbacks | Britney Spears - Toxic |
| 2 | 0 | Throwbacks | Beyoncé - Crazy In Love |
| ..... |
Note that the
songsDataFrame has only the three variables—pid,playlist_name, andsong, as shown above.Write code to determine which two different songs appear together in playlists more often than any other pair, as shown below.
- (Hint: self‑merge the
songsDataFrame onpidto getsong_x-song_ypairs, which is a many-to-many join.)
- (Hint: self‑merge the
| Index | song_x | song_y | count |
|---|---|---|---|
| 76 | Kendrick Lamar – HUMBLE. | Lil Uzi Vert – XO TOUR Llif3 | 67 |
Below is how songs DataFrame is created:
songs = (
    spotify
    .drop_duplicates(subset = ['pid', 'playlist_name', 'artist_name', 'track_name'])
    [['pid', 'playlist_name', 'artist_name', 'track_name']]
    )

songs['song'] = songs['artist_name'] + ' – ' + songs['track_name']
songs = songs[['pid', 'playlist_name', 'song']]
Click to Check the Answer!
pairs = songs.merge(songs, on='pid')

pair_counts = (
    pairs[['song_x','song_y']]
    .value_counts()
    .reset_index()
    .query('song_x != song_y')
    .nlargest(1, 'count', keep = "all")
)

# Note: Lexicographic filtering is necessary to treat (song_x, song_y) and (song_y, song_x) as the same pair.
Section 4. Pandas Basics II
Below is shoes DataFrame that reads the file onlinestore_shoes_simple.csv containing data of “shoes” search information from an online store.
shoes = pd.read_csv('https://bcdanl.github.io/data/onlinestore_shoes_simple.csv')Variable Description
| Variable | Description |
|---|---|
id |
Unique identifier for the product |
brandId |
Unique identifier for the brand |
brandName |
Name of the brand |
name |
Product name or title |
reviewCount |
Number of customer reviews |
reviewStarRating |
Average star rating from customer reviews |
current_p |
Current price |
clearance_p |
Clearance price (NA if not available for clearance) |
Question 15 (Points: 5)
- Write code to identify the top deal product(s), where a deal is defined by all of the following:
- On clearance: the product’s
current_pequals itsclearance_p. - Highly reviewed:
reviewCountis at or above the 95th percentile of allreviewCountvalues. - Best rated: among these clearance, highly‑reviewed products, it has the maximum
reviewStarRating(including any ties).
- On clearance: the product’s
| Index | id | brandId | brandName | name | reviewCount | reviewStarRating | currernt_p | clearance_p |
|---|---|---|---|---|---|---|---|---|
| 92 | 6545910 | 9423 | Tory Burch | Ballet Loafer | 1008 | 4.8 | 178 | 178 |
| 393 | 7248724 | 9423 | Tory Burch | Howell Court Sneaker | 1044 | 4.8 | 88 | 88 |
| 6318 | 5654262 | 15361 | See Kai Run | Stevie II Sneaker | 113 | 4.8 | 35 | 35 |
Click to Check the Answer!
review_top5 = shoes['reviewCount'].quantile(.95)
shoes_promo = (
    shoes[(shoes['clearance_p'] == shoes['currernt_p']) & (shoes['reviewCount'] >= review_top5) ]
    .nlargest(1, 'reviewStarRating', keep = 'all')
    )
Question 16 (Points: 7)
- Write pandas code to:
- Count products per brand: determine how many items each brand offers.
- Find the 90th‑percentile threshold of those brand‑level counts.
- Select “popular” brands whose product counts exceed that threshold.
- Compute clearance rates for each of these popular brands: the fraction of their items with a non‑missing
clearance_p. - List the top five brands by clearance rate, reporting each brand and its rate, as shown in below DataFrame.
| Index | brandName | count_x | count_y | rate |
|---|---|---|---|---|
| 4 | MIA | 51 | 76 | 0.6710526 |
| 1 | Fly London | 76 | 125 | 0.6080000 |
| 8 | Vince Camuto | 41 | 77 | 0.5324675 |
| 13 | Keds® | 37 | 70 | 0.5285714 |
| 12 | Cole Haan | 37 | 85 | 0.4352941 |
Click to Check the Answer!
# 1. Count total products per brand
total_per_brand = shoes['brandName'].value_counts().reset_index()

total_per_brand_n = total_per_brand['count'].quantile(.9)
total_per_brand = total_per_brand[total_per_brand['count'] >= total_per_brand_n]

# 2. Count total products per brand
shoes['clearance_available'] = shoes['clearance_p'].notna()

total_per_brand_c = (
    shoes
    .query('clearance_available == True')['brandName']
    .value_counts()
    .reset_index()
    )

# 3. Join
df = total_per_brand_c.merge(total_per_brand, on='brandName', how = 'left')
df = df[~df['count_y'].isna()]
df['rate'] = df['count_x'] / df['count_y']
df_top5 = df.nlargest(5, 'rate', keep = 'all')