Code
library(tidyverse)
library(skimr)Midterm Exam
I solemnly swear that I will not cheat or engage in any form of academic dishonesty during this exam.
I will not communicate with other students or use unauthorized materials.
I will uphold the integrity of this exam and demonstrate my own knowledge and abilities.
By taking this pledge, I acknowledge that academic dishonesty undermines the academic process and is a violation of the trust placed in me as a student.
I accept the consequences of any violation of this promise.
library(tidyverse)
library(skimr)The following describes the context of the data.frame, trashwheel.
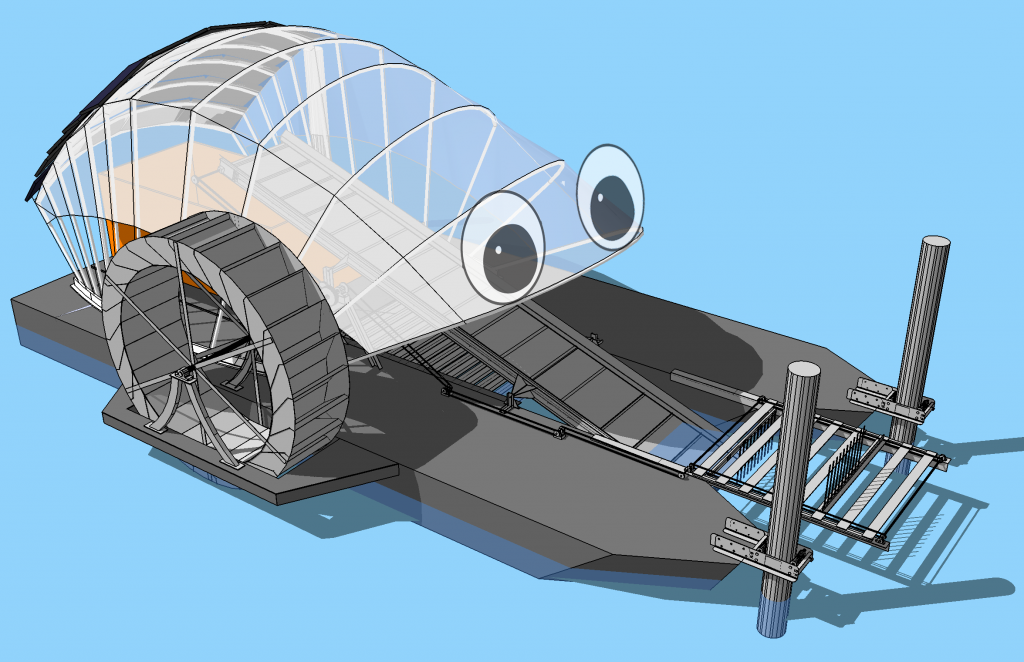
Mr. Trash Wheel is a semi-autonomous trash interceptor that is placed at the end of a river, stream or other outfall.
Far too lazy to chase trash around the ocean, Mr. Trash Wheel stays put and waits for the waste to flow to him.
Sustainably powered and built to withstand the biggest storms, Mr. Trash Wheel uses a unique blend of solar and hydro power to pull hundreds of tons of trash out of the water each year.


trashwheel <- read_csv('https://bcdanl.github.io/data/trashwheel.csv')| variable | type | description |
|---|---|---|
Name |
character | Name of the Trash Wheel |
Month |
character | Month |
Year |
numeric | Year |
Date |
character | Date (Monthly) |
Weight |
numeric | Weight in tons |
Volume |
numeric | Volume in cubic yards |
PlasticBottles |
numeric | Number of plastic bottles |
Polystyrene |
numeric | Number of polystyrene items |
CigaretteButts |
numeric | Number of cigarette butts |
GlassBottles |
numeric | Number of glass bottles |
PlasticBags |
numeric | Number of plastic bags |
Wrappers |
numeric | Number of wrappers |
SportsBalls |
numeric | Number of sports balls |
HomesPowered |
numeric | Homes Powered - Each ton of trash equates to on average 500 kilowatts of electricity. An average household will use 30 kilowatts per day. |
unique(trashwheel$Name)[1] "Captain Trash Wheel" "Gwynnda Trash Wheel" "Mister Trash Wheel"
[4] "Professor Trash Wheel"Volume for “Mister Trash Wheel”.q1a <- filter(trashwheel, Name == "Mister Trash Wheel")
skim(q1a$Volume)| Name | q1a$Volume |
| Number of rows | 115 |
| Number of columns | 1 |
| _______________________ | |
| Column type frequency: | |
| numeric | 1 |
| ________________________ | |
| Group variables | None |
Variable type: numeric
| skim_variable | n_missing | complete_rate | mean | sd | p0 | p25 | p50 | p75 | p100 | hist |
|---|---|---|---|---|---|---|---|---|---|---|
| data | 0 | 1 | 83.38 | 58.59 | 15 | 42.5 | 77 | 117 | 336 | ▇▆▂▁▁ |
Weight varies by Name.
ggplot(trashwheel, aes(x = Weight, fill = Name)) +
  geom_histogram(bins = 15,
                 show.legend = F) +
  facet_wrap(Name ~ .)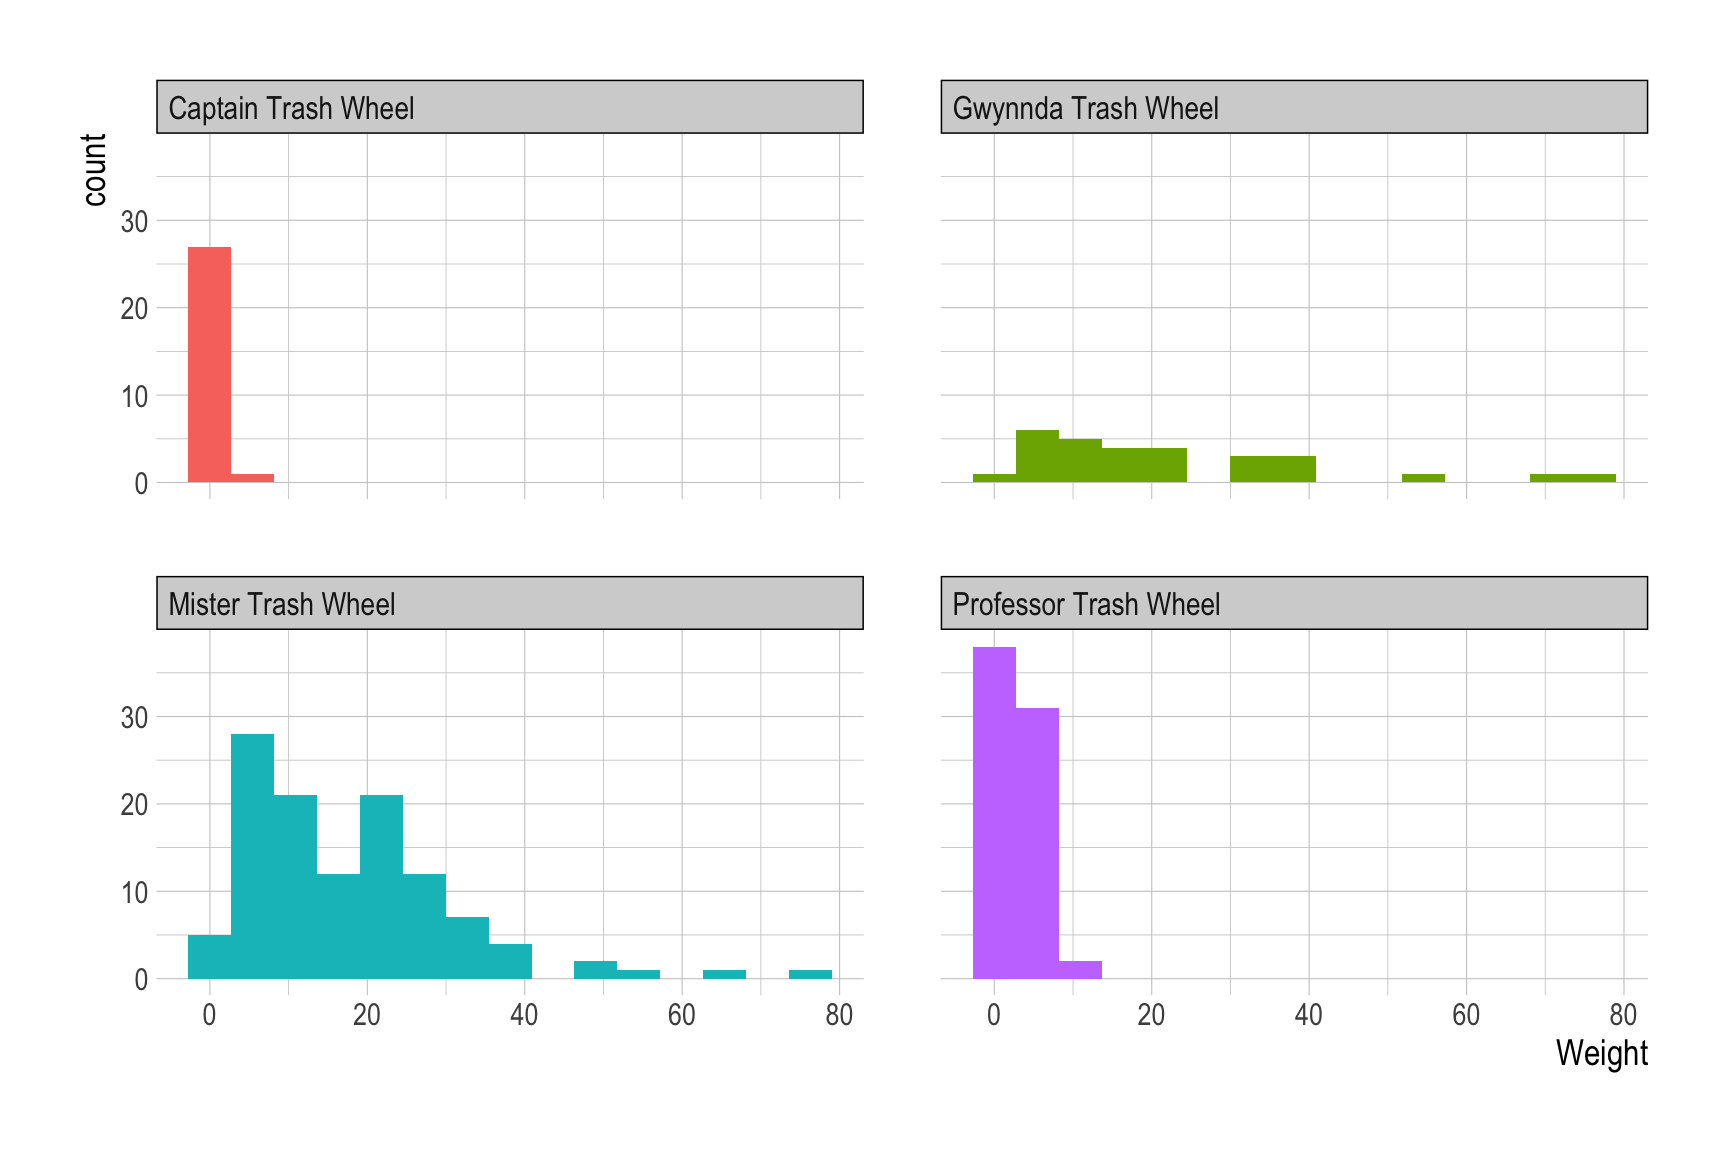
Weight varies by Name, as visualized in Q1b.HomesPowered varies by Name.ggplot(trashwheel, aes(x = Date, y = HomesPowered)) +
geom_line(aes(color = Name),
show.legend = F) +
geom_point(size = .5) +
geom_smooth(se = F) +
facet_wrap(Name ~ ., scales = "free") 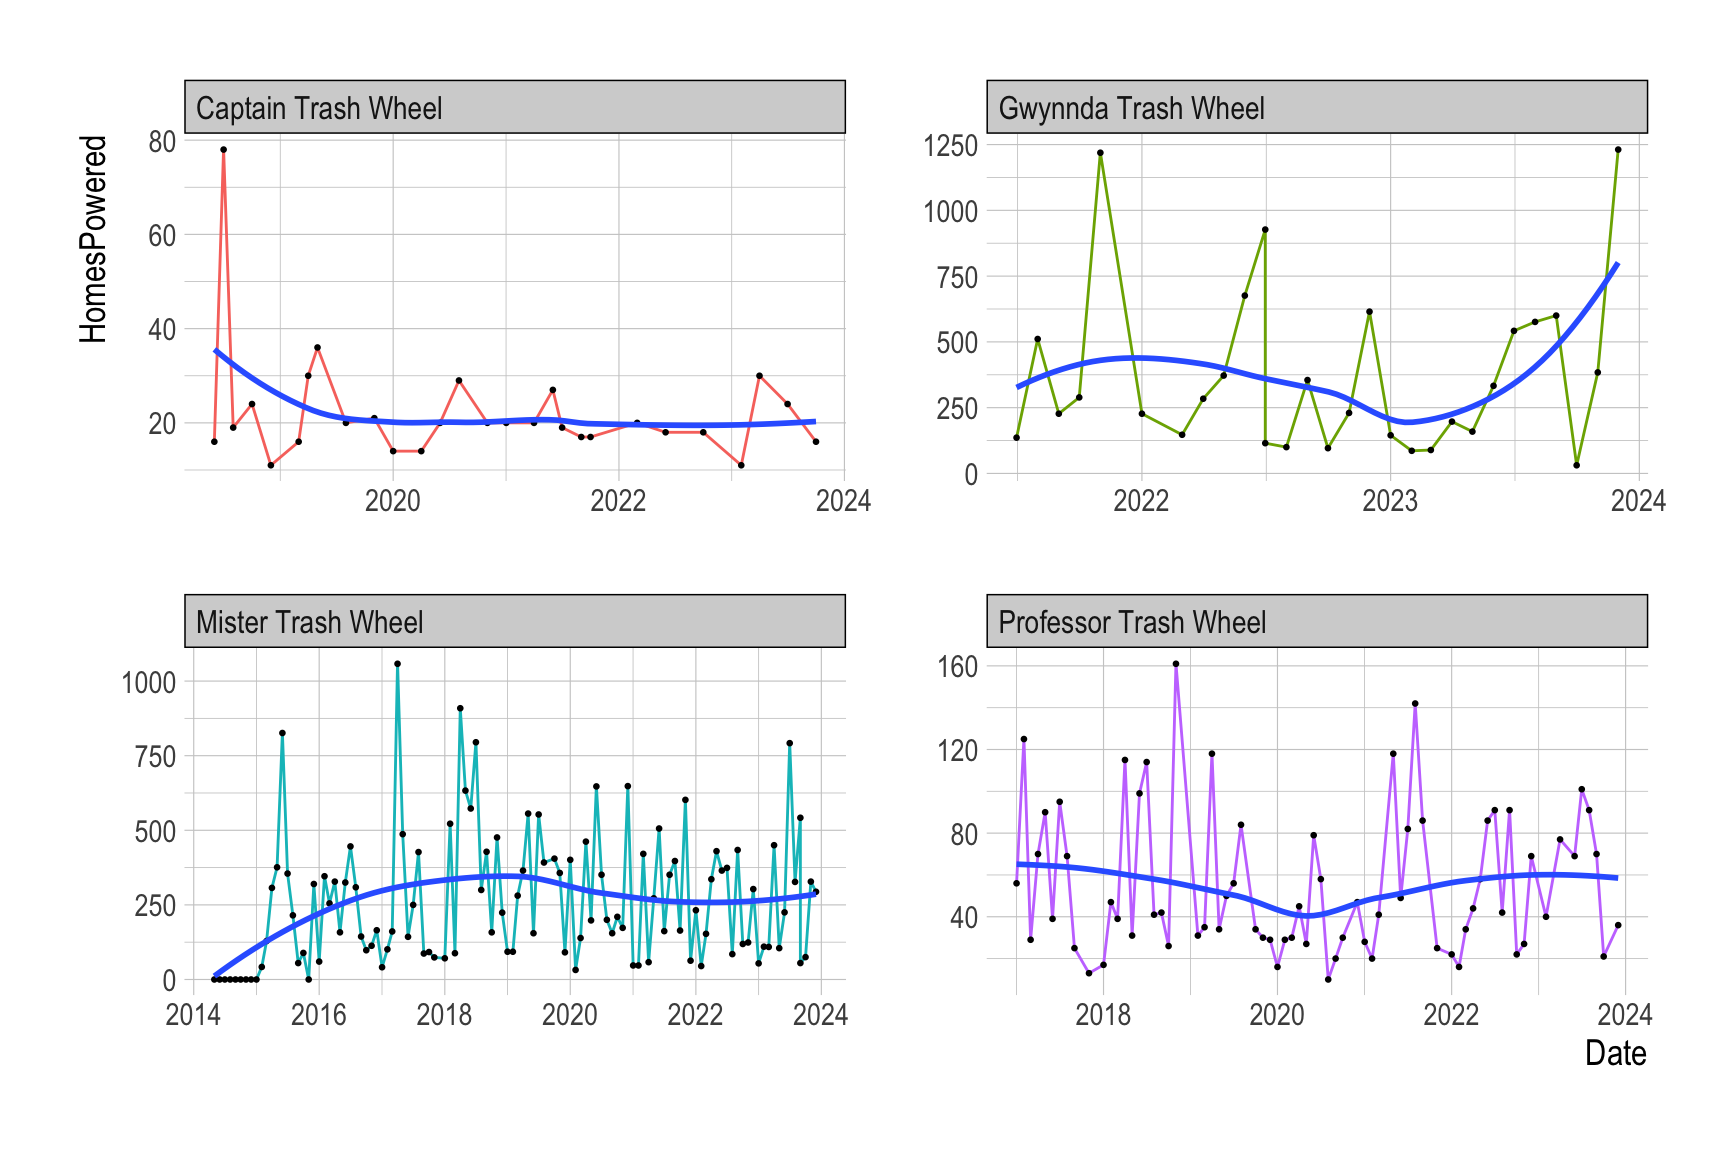
HomesPowered varies by Name, as visualized in Q1d.For Part II, use the following data.frame, trashwheel_long.
| variable | type | description |
|---|---|---|
Name |
character | Name of the Trash Wheel |
Date |
character | Date (Monthly) |
Trash_Type |
numeric | Type of Trashes |
Number |
numeric | Number of trash items |
unique(trashwheel_long$Trash_Type)[1] "CigaretteButts" "GlassBottles" "PlasticBags" "PlasticBottles"
[5] "Polystyrene" "SportsBalls" "Wrappers" log10(Number) varies by Trash_Type and Name.ggplot(data = trashwheel_long, aes(x = Date, y = log10(Number))) +
geom_line(aes(color = Trash_Type),
linewidth = .25) +
geom_point(size = .1) +
geom_smooth(aes(color = Trash_Type),
se = F) +
facet_wrap(Name ~ ., scales = "free") +
scale_color_brewer(palette = 'Dark2') + # we did not cover this
theme(legend.position = "top") # we did not cover this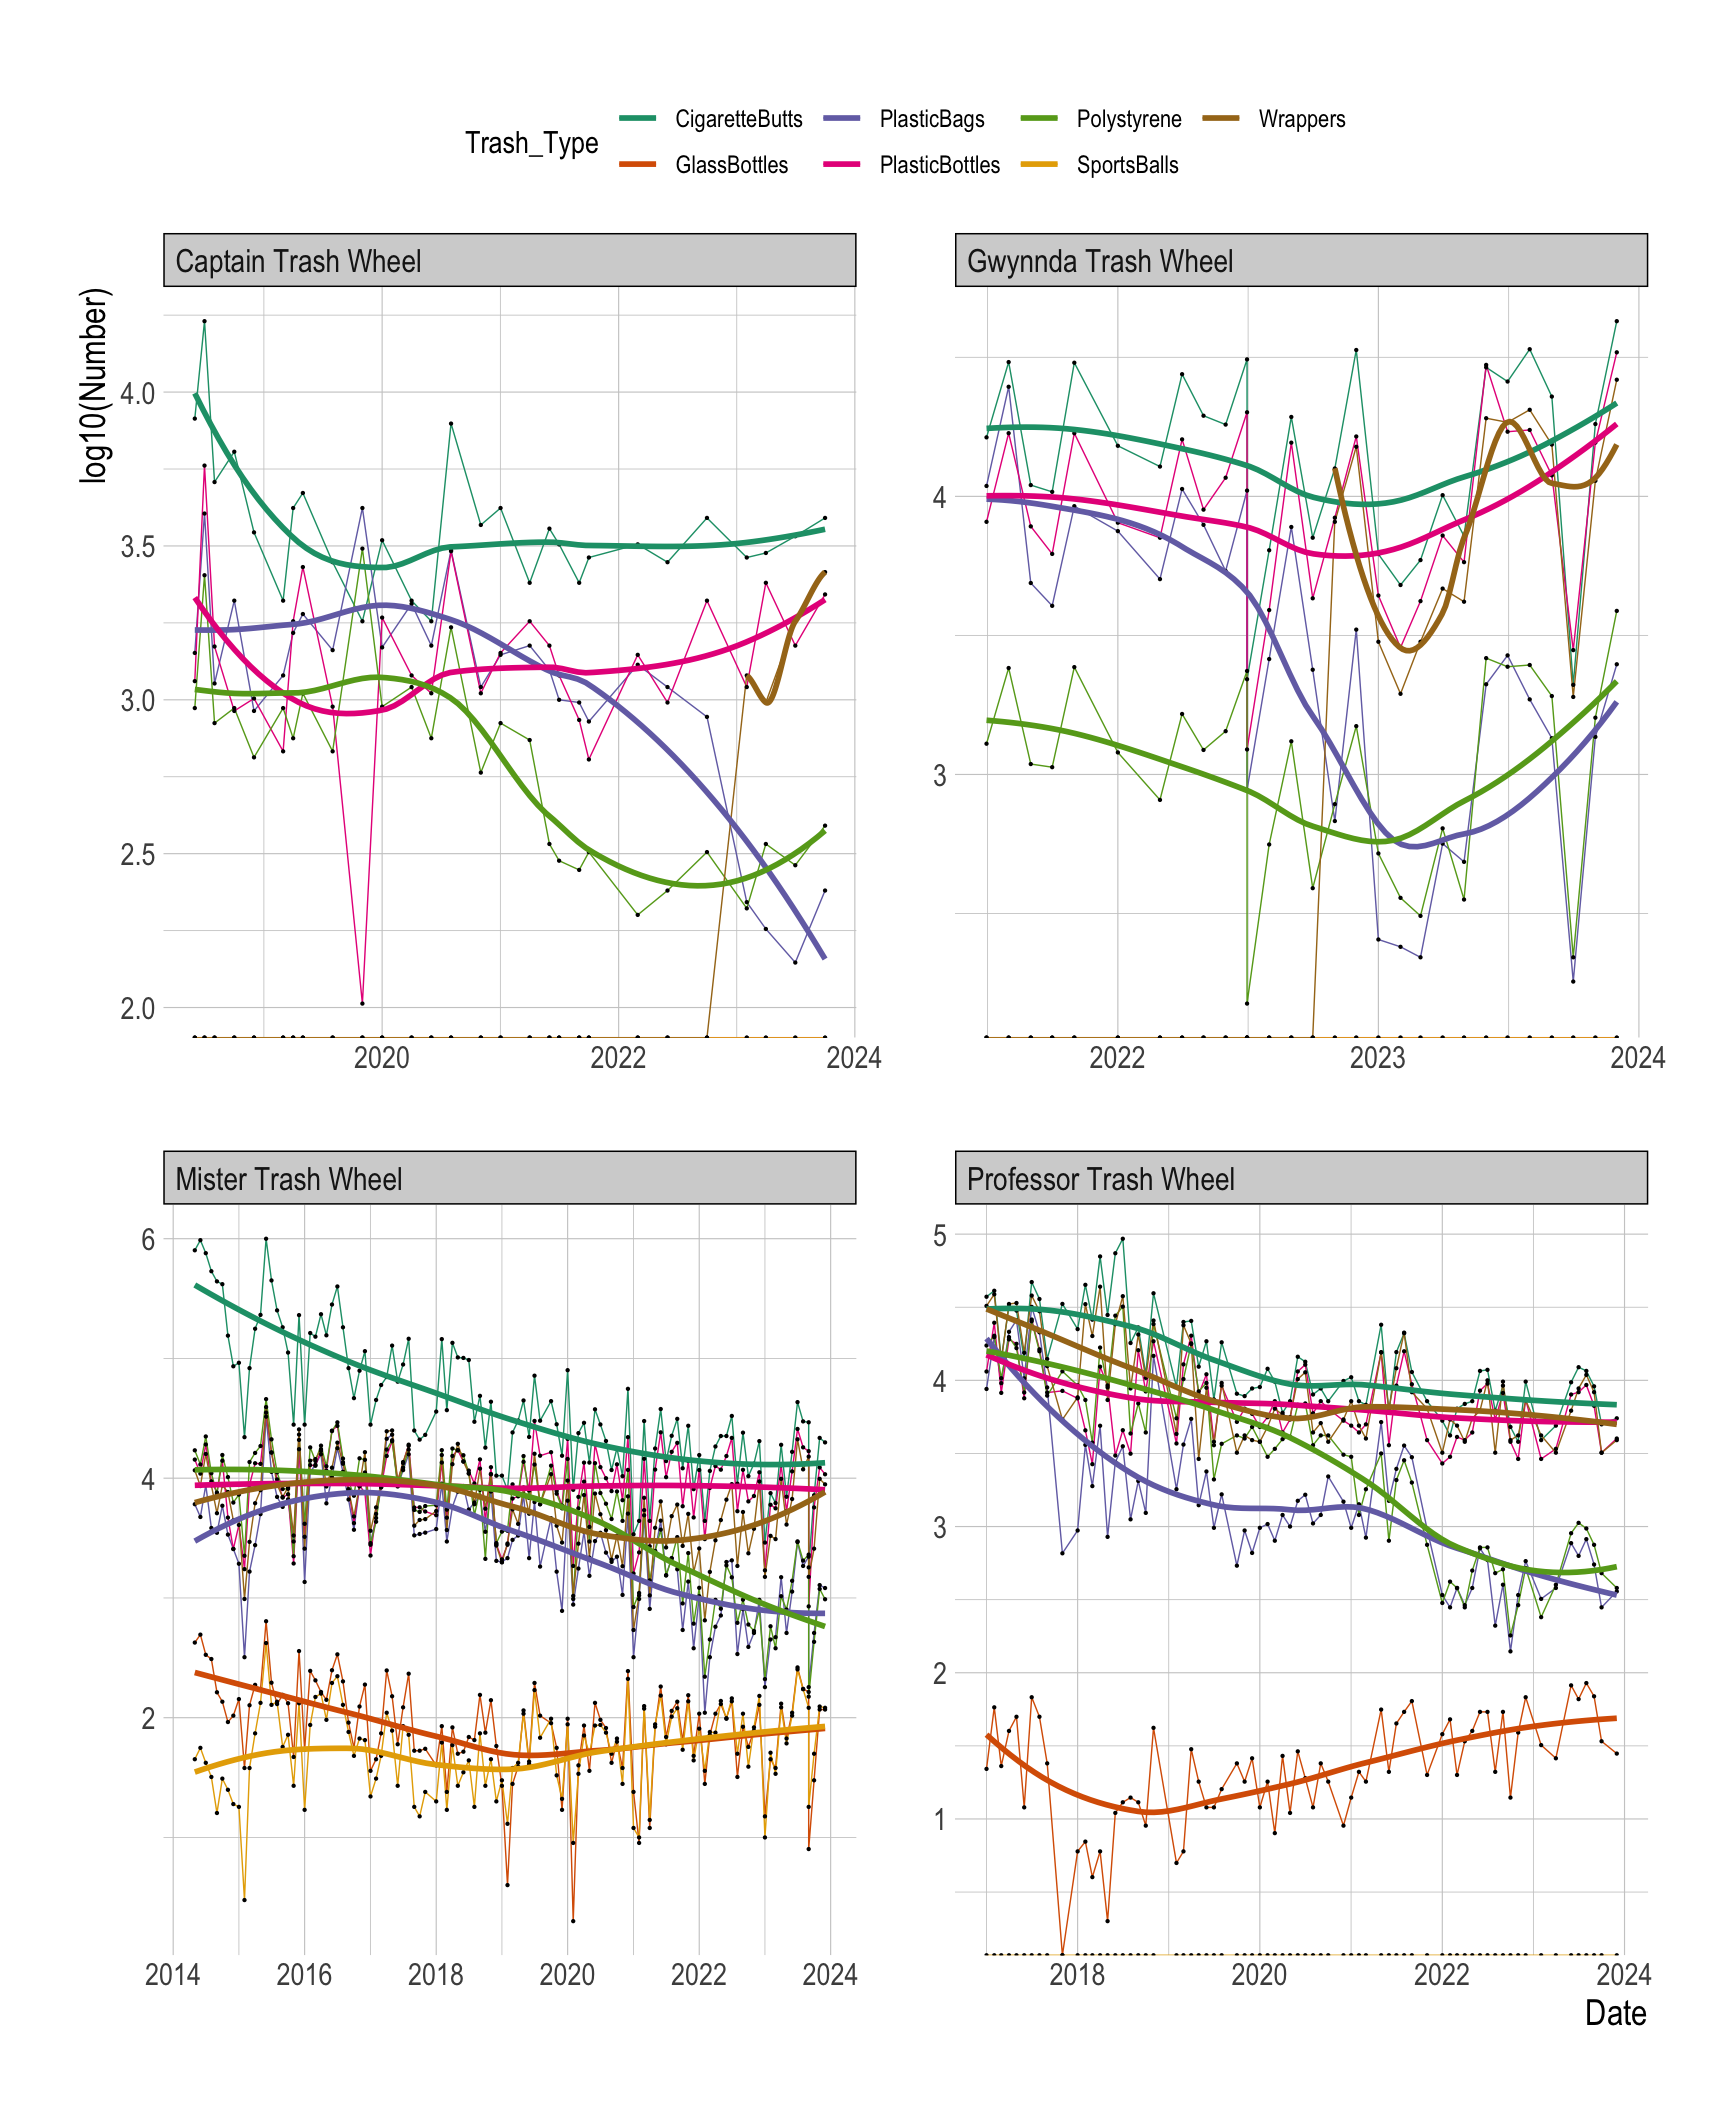
log10(Number) varies by Trash_Type and Name, as visualized in Q1f.log10(Number) varies by Trash_Type and Name.ggplot(trashwheel_long, aes(x = log10(Number), y = Trash_Type)) +
geom_boxplot(aes(fill = Trash_Type), show.legend = F) +
facet_wrap(Name ~ ., scales = "free") 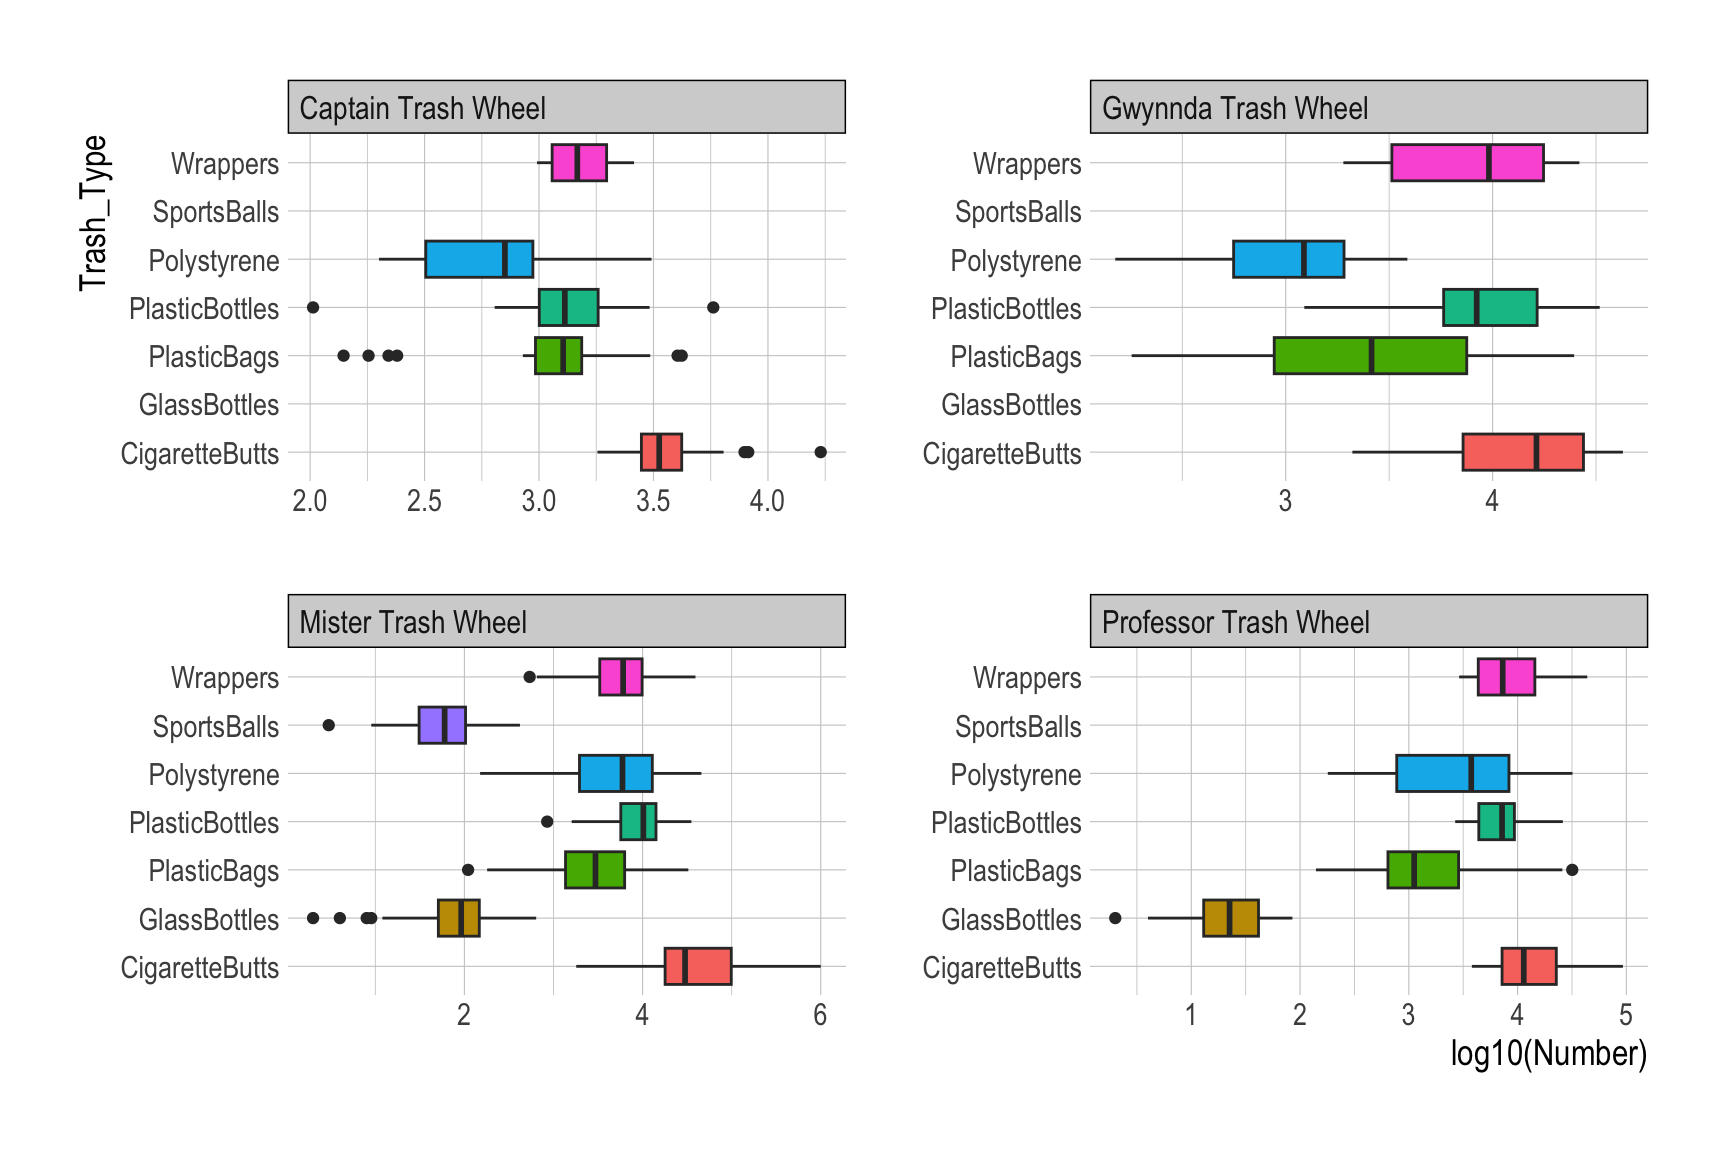
Number varies by Trash_Type and Name, as visualized in Q1h.
Number of “CigaretteButts” varies by Name.The following describes the context of the data.frame, safi.
SAFI (Studying African Farmer-Led Irrigation) is a currently running project which is looking at farming and irrigation methods. This is survey data relating to households and agriculture in Tanzania and Mozambique. The survey covered such things as; household features (e.g. construction materials used, number of household members), agricultural practices (e.g. water usage), assets (e.g. number and types of livestock) and details about the household members.
The dataset for the SAFI survey is stored in safi_survey.csv (with its pathname https://bcdanl.github.io/data/safi_survey.csv).
Write an R code to read the CSV file, safi_survey.csv, using the tidyverse’s read_csv() function, and assign it to safi.
safi <- read_csv('https://bcdanl.github.io/data/safi_cleaned.csv')| variable | class | description |
|---|---|---|
| key_ID | integer | Added to provide a unique Id for each observation. |
| village | character | Village name |
| no_membrs | integer | Number of members in the household |
| years_liv | integer | Number of years living in this village or a neighboring village |
| respondent_wall_type | character | Type of walls the house has |
| rooms | integer | Number of rooms in the main house used for sleeping |
| memb_assoc | character | Are you a member of an irrigation association? |
| affect_conflicts | character | Have you been affected by conflicts with other irrigators in the area? |
| liv_count | integer | Livestock count |
| no_meals | integer | How many meals do people in your household normally eat in a day? |
| months_lack_food | character | Indicate which months, In the last 12 months have you faced a situation when you did not have enough food to feed the household? |
unique(safi$village)[1] "God" "Chirodzo" "Ruaca" unique(safi$respondent_wall_type)[1] "muddaub" "burntbricks" "sunbricks" "cement" unique(safi$memb_assoc)[1] "yes" "no" unique(safi$affect_conflicts)[1] "once" "never" "more_once" "frequently"memb_assoc varies by affect_conflicts.df <- safi |>
mutate(affect_conflicts = factor(affect_conflicts,
levels = c("never", 'once',
'more_once', 'frequently'))) # using this is optional
ggplot(data = df,
aes(x = affect_conflicts,
fill = memb_assoc)) +
geom_bar(position = 'fill') +
labs(y = 'prop')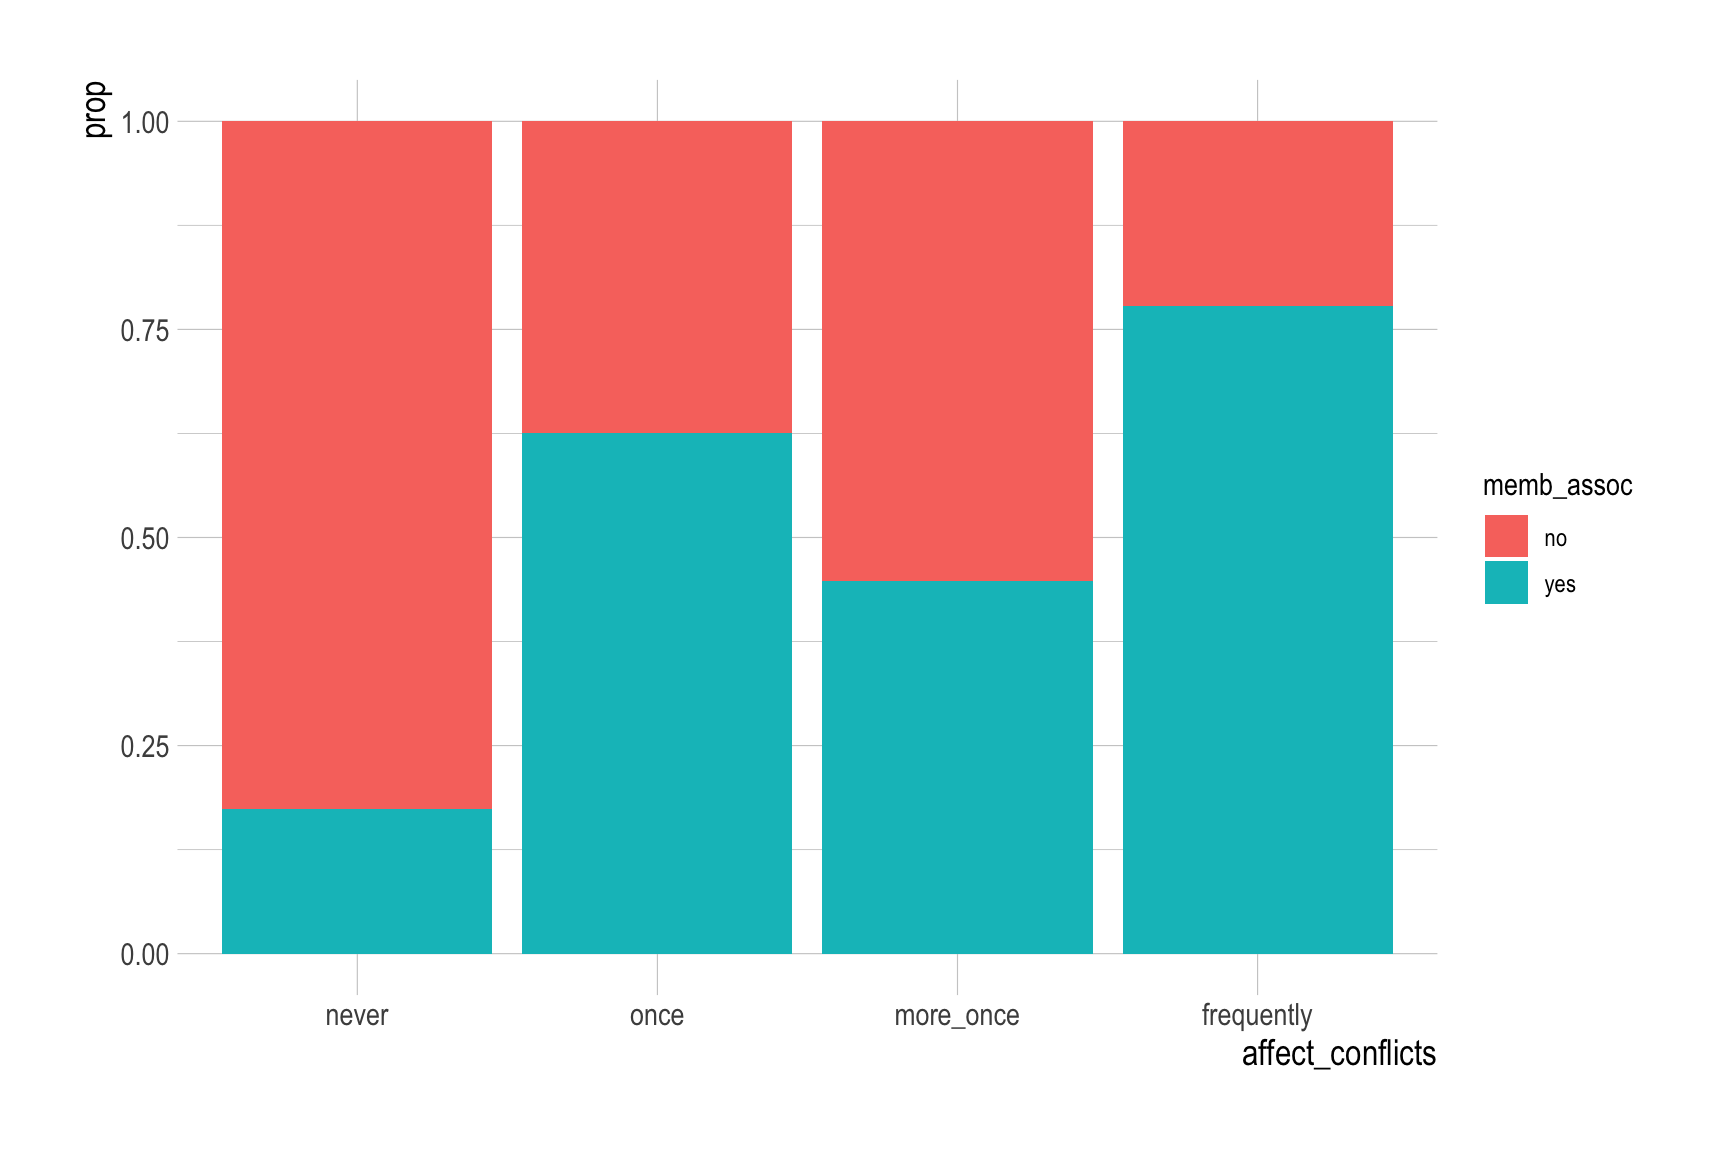
memb_assoc varies by affect_conflicts, as visualized in Q2b.For Q2d, use the following data.frame, safi_long, which results from splitting a character of months_lack_food in safi into multiple rows:
unique(safi_long$months_lack_food) [1] "01" "09" "10" "11" "12" "02" "03" "04" "05" "06"
[11] "07" "08" "none"months_lack_food varies by memb_assoc.ggplot(safi_long,
aes(x = months_lack_food,
fill = memb_assoc)) +
geom_bar(position = position_dodge2(preserve = 'single')) # geom_bar(position = 'dodge') suffices for the answer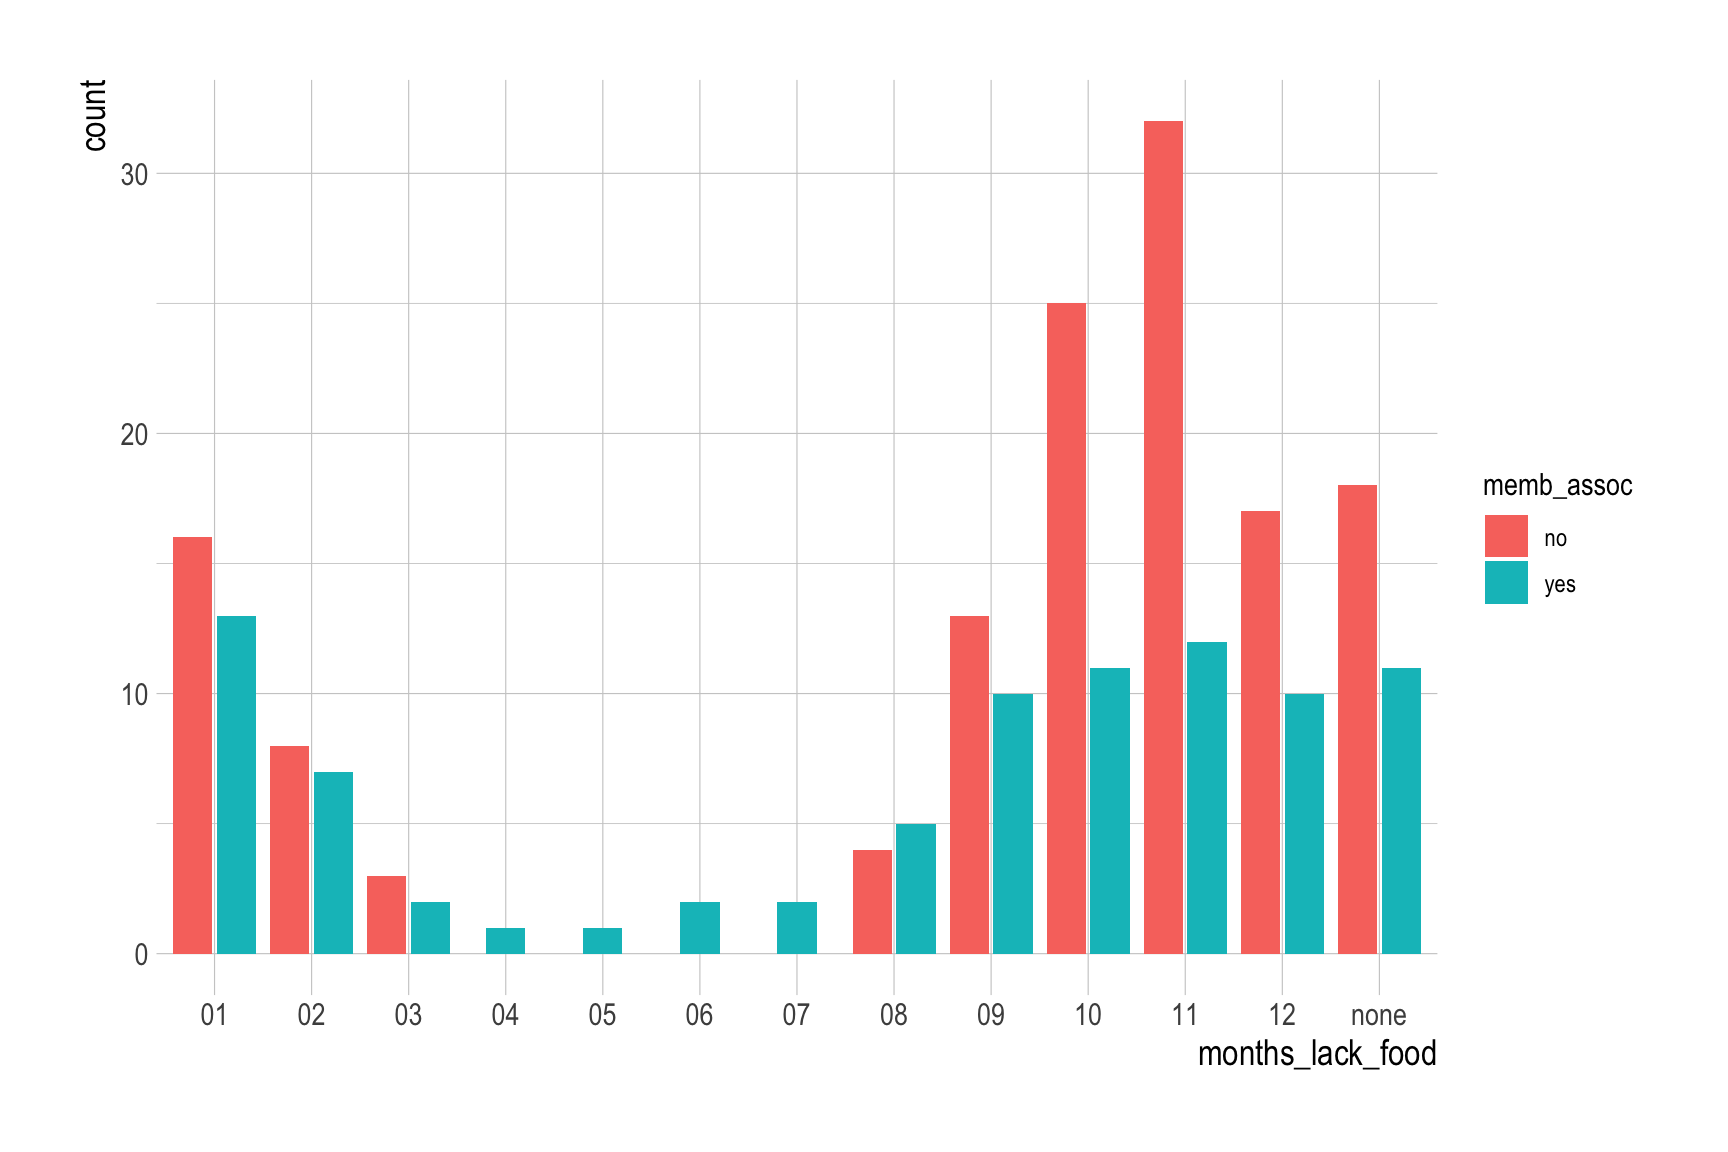
months_lack_food varies by memb_assoc, as visualized in Q2d