Lecture 2
Data Analytics Thinking and Tools
August 26, 2026
🧠 Data Analytics Thinking
☕ Where should the company open its next café?
A small café company can afford one new location and must choose between two available leases.
Think, pair, share
Which evidence would you request first—and how could it change the choice?
- foot traffic by hour and day—and how many passersby might buy;
- rent, labor costs, and lease terms;
- nearby competitors and businesses that generate demand; or
- sales, margins, and seasonal patterns at comparable cafés.
A busier location may generate more sales—but not more profit.
🎯 Data analytics thinking starts with a decision
Evidence-based decision making is the goal; data analytics thinking is the method.
Weak starting point
“What patterns are in the location data?”
Missing: a decision and a goal.
Decision-ready starting point
“Which site is more likely to break even within 12 months, given demand and costs?”
Decision maker: café owner
Action: sign one lease
Outcome: break even within 12 months
Is an accurate sales forecast enough to choose a lease? Why or why not?
🧭 Four kinds of analytical questions
| Type | What it asks | Café-location example |
|---|---|---|
| Descriptive | What happened? | How busy were similar cafés? |
| Diagnostic | Why did it happen? | Why were some cafés more profitable? |
| Predictive | What may happen? | What sales and costs might each site have? |
| Prescriptive | What should we do? | Which lease should the company choose? |
Quick classification: “Comparable cafés near transit had high sales but modest profits.” What does this describe, and what would you compare to investigate why?
🔍 A useful question tells us what to look for
Too broad: “Which location looks best?”
Answerable: “Which site is more likely to break even within 12 months after accounting for customer demand, rent, labor, and seasonal variation?”
- Specific: identifies the sites, outcome, and time horizon.
- Comparable: evaluates the same outcome for both sites.
- Actionable: the answer can change the lease decision.
Turn and talk
“Break even” means total revenue covers total costs. To estimate whether each site will break even, what data would you need?
🗺️ Which location should the café choose?
Hypothetical scenario: The company can sign only one lease.
| Factor | Site A: Downtown offices | Site B: Transit neighborhood |
|---|---|---|
| Average weekday passersby | 8,000 | 4,800 |
| Monthly rent | $18,000 | $10,000 |
| Nearby cafés | 6 | 2 |
| Traffic pattern | Strong lunch; quiet evenings and weekends | Strong mornings and evenings; steadier weekends |
Decide with a partner
- Choose Site A, Site B, or ask for more information.
- What missing fact is most likely to reverse your choice?
- What should decide the lease: sales, profit, or time to break even?
🏟️ Sports Analytics Applications
⚾ Moneyball made measurement part of strategy


- The book appeared in 2003; the film adaptation appeared in 2011.
- Data can complement expertise by questioning familiar measures and testing assumptions.
Discuss
What can a scout capture that a table may miss—and what can the table reveal that memory may miss?
🏢 Sports analytics supports team-wide decisions
| Decision area | Decision-ready example question |
|---|---|
| Player performance | Which skills predict success in this role next season? |
| Team tactics | Which option performs best against this opponent and game state? |
| Health and workload | When should workload change training or recovery? |
| Recruitment | Who best fits the role, roster, and salary limit? |
| Fan and business | Who may not renew—and which outreach changes behavior? |
To support a decision, clarify who will act, what action is possible, what outcome matters, what is being compared, and when the answer is needed. Also consider which mistake would be more costly.
🗣️ Stated intent predicts behavior—but imperfectly
A major-league baseball team surveyed season-ticket holders before renewal and later observed whether they actually renewed.
Tier = a seat-location segment. Columns: Highly Likely = strong yes; Likely = probable yes; Maybe = uncertain; Probably Not = probable no; Certainly Not = strong no. Cells = the percentage who actually renewed.
| Tier | Highly Likely | Likely | Maybe | Probably Not | Certainly Not |
|---|---|---|---|---|---|
| 1 | 92 | 88 | 75 | 67 | 45 |
| 2 | 88 | 81 | 70 | 65 | 38 |
| 3 | 80 | 76 | 66 | 55 | 36 |
| 4 | 77 | 72 | 65 | 45 | 25 |
| 5 | 75 | 70 | 60 | 35 | 25 |
Use the table: What pattern shows that customers’ stated intentions are useful? What pattern shows that they are not guarantees?
📣 Prediction is not persuasion
Among Tier 1 respondents who said “Probably Not,” 67% ultimately renewed.
Prediction: Who will renew?
Persuasion: Whose outcome changes because of outreach?
A brief targeting decision
The team can contact only 1,000 accounts.
- Which segment would you prioritize, and why?
- What missing fact could reverse your choice?
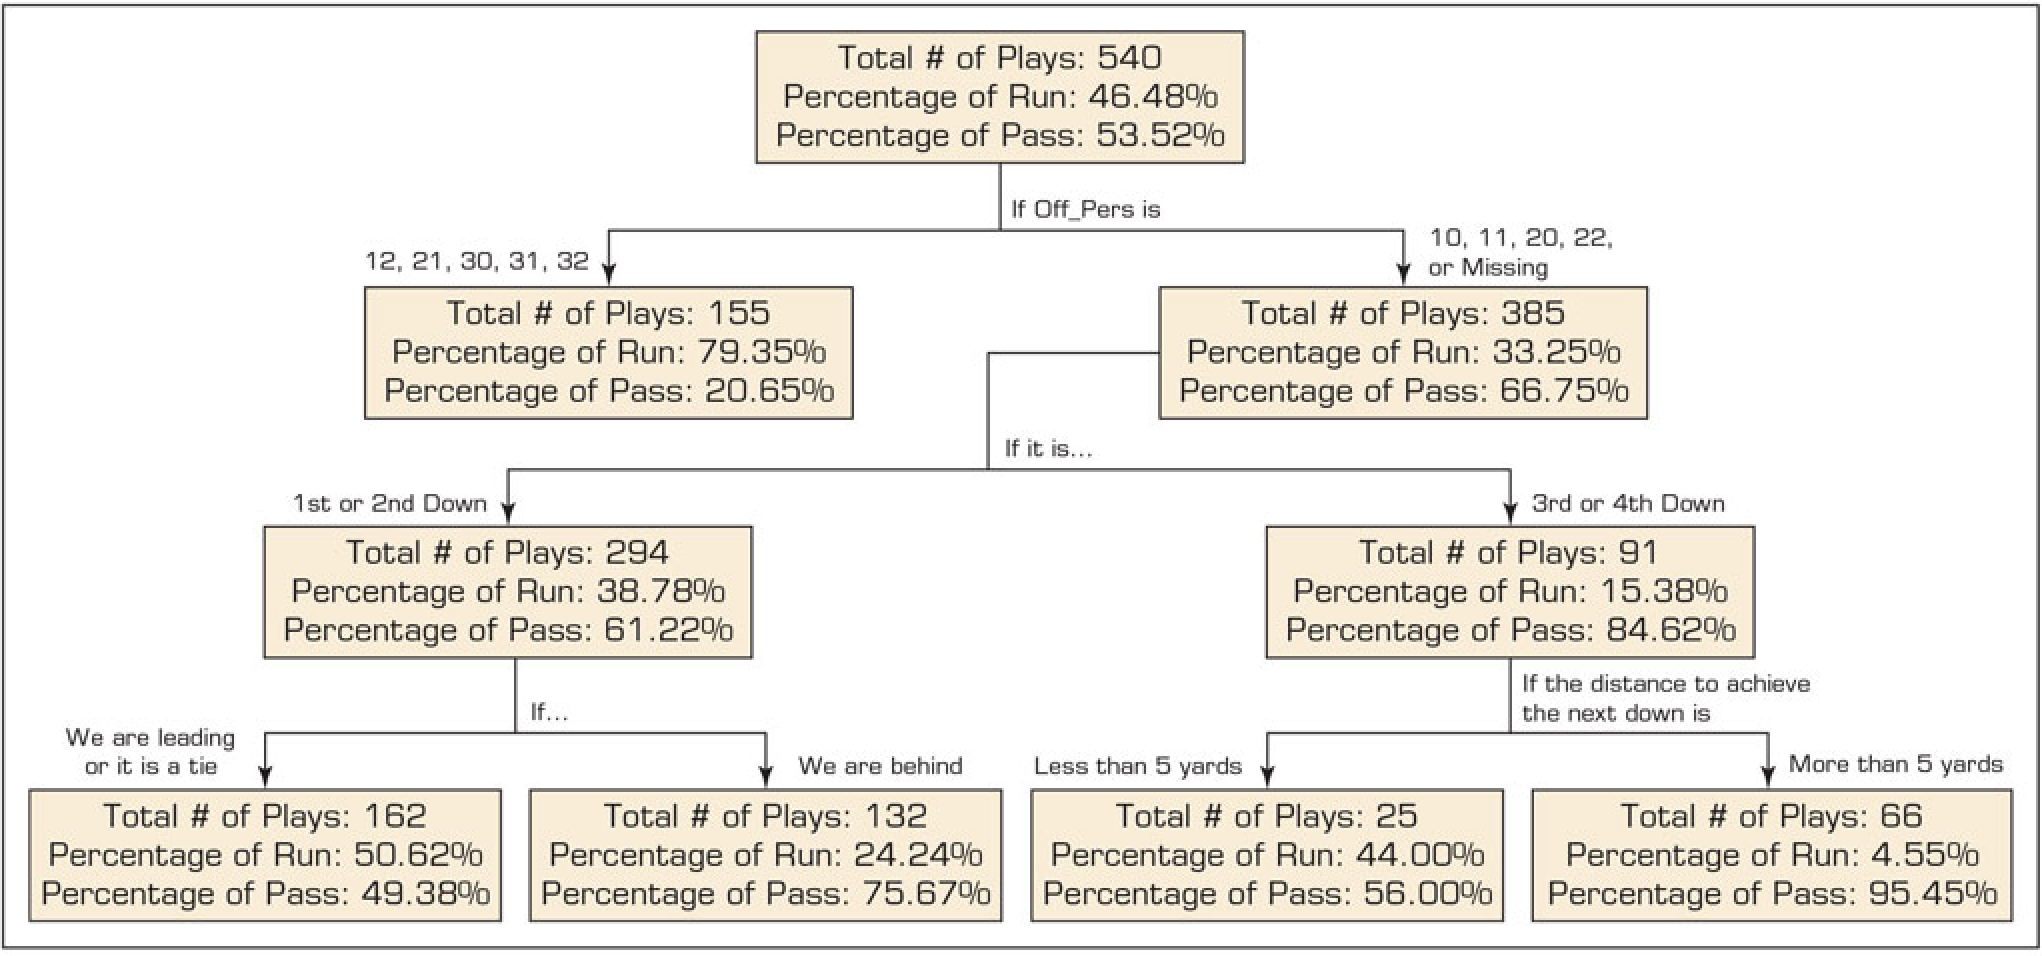
🌳 A decision tree follows game conditions
- First split —
Off_Pers(offensive personnel): “11” means 1 running back + 1 tight end + 3 wide receivers. The tree first groups plays by who is on the field.
🎲 A 95% pattern is still not a certainty
plays in this leaf were passes: 95.45%.
Discuss
Should the defense act as if a pass is guaranteed? What is the cost of preparing for the wrong play?
🏒 Plus-minus is common—but context-sensitive
Plus-minus (PM): +1 for an on-ice even-strength or short-handed goal for; −1 for one against.
Official since 1959–60, PM is a long-standing, routinely reported NHL statistic—not a stand-alone measure of player ability.
| 2025–26 regular season | Team | Points | PM |
|---|---|---|---|
| Nathan MacKinnon | COL | 127 | +57 |
| Nikita Kucherov | TBL | 130 | +43 |
| Connor McDavid | EDM | 138 | +17 |
Discuss
The players rank differently by points and PM. Using only this table, what can you reasonably say about individual performance? What additional evidence would you request before choosing a player?
📈 Business Intelligence
⏱️ Business intelligence enables recurring decisions
Business intelligence (BI) combines regularly updated data, consistent definitions, analysis, and reporting so an organization can monitor performance and make recurring decisions.
Operations data → Defined metrics → Dashboard → Decision → Review
One-time analysis
Why did one subway line fall last month?
BI system
Each month, monitor journey time, waiting, service, and equipment by line.
Dashboard: a shared visual display of selected, regularly refreshed metrics for comparison and action—MTA Performance Metrics.
🛠️ Popular dashboard tools take different paths
| Tool | Often chosen for | Example |
|---|---|---|
| Tableau | Interactive public data stories | Zillow Market Heat Index |
| Power BI | Reporting in Microsoft-centered organizations | SUNY Geneseo IR&E dashboards |
| Looker | Shared metrics built from governed data models | Sales and Customer Insights sample |
| R / Python | Code-based, reproducible dashboards | Quarto dashboard gallery |
Choose for the data ecosystem, audience, update cycle, and who will maintain the dashboard—not for the logo.
🔗 Key performance indicator (KPI): goal to measure
Key performance indicator (KPI): a metric deliberately selected to judge progress toward a goal and guide action.
Goal
Reliable subway travel.
Metric
Customer journey time performance: the share of trips completed within five minutes of schedule.
KPI in use
Compare with a target or baseline; investigate lines that fall short.
A decision-ready KPI needs: a definition, desired direction or target, time window, comparison, owner, and linked response.
🚦 Key performance indicator (KPI) guides action
The primary KPI represents the goal; supporting metrics help explain why it moved.
| Dashboard metric | What it measures | Decision use |
|---|---|---|
| Customer journey time performance | % of trips within 5 minutes of schedule | Track the rider outcome |
| Additional platform time | Average extra wait beyond schedule | Diagnose waiting problems |
| Service delivered | % of scheduled service operated | Diagnose cancellations or capacity |
| Mean distance between failures | Miles between equipment failures | Target maintenance |
Discuss: Service delivered rises, but journey performance falls and extra waiting rises. Has service improved? Choose the primary KPI, one diagnostic metric, and a comparison before acting.
🧪 Classwork
Try it out → Classwork 1: NYC 311 Dashboard I
🧰 DANL Tools
🧭 Each tool has a different job
| Tool | Category | Best fit |
|---|---|---|
| Excel | Spreadsheet | Quick calculations, charts, and sharing |
| SQL | Database language | Request useful tables from stored data |
| R / Python | Programming languages | Analysis, visualization, modeling, and automation |
| RStudio / Jupyter | Working environments | Write, run, and explain code |
| Git / GitHub | Version control / hosting | Record history; collaborate and publish |
Use a stack: choose tools for the task, team, and output.
⚖️ Excel and programming support different workflows
| Dimension | Excel | Programming with R / Python |
|---|---|---|
| Work is recorded as | Cells, formulas, and workbook steps | Code and scripts |
| Especially convenient for | Quick viewing, editing, calculations, and charts | Repeatable, multi-step analysis |
| Collaboration advantage | Familiar files for spreadsheet users | Exact reruns, reviewable logic, and version history |
| Move this direction when | The task is small-scale and involves hands-on editing | Updates, many files, automation, or extension matter |
Practical rule: use Excel for quick viewing and exchange; use programming when the analysis must be rerun, checked, automated, or extended.
🗄️ SQL asks a database for a useful table
A database stores tables. A row is one item; a column describes it.
Stored table
| Request | Borough | Type |
|---|---|---|
| 101 | Bronx | Noise |
| 102 | Queens | Noise |
| 103 | Bronx | Noise |
| 104 | Brooklyn | Heat |
| 105 | Brooklyn | Noise |
Question
How many Noise requests came from each borough?
A query is a request for specific data or a summary.
Result table
| Borough | Noise requests |
|---|---|
| Bronx | 2 |
| Brooklyn | 1 |
| Queens | 1 |
SQL (Structured Query Language) queries tables stored in databases.
Where it fits: SQL retrieves and summarizes database data; Excel inspects it; R or Python analyze, visualize, and automate.
💻 R and Python have different strengths
| Comparison | R | Python |
|---|---|---|
| Main focus | Statistics and data analysis | Programming for many kinds of tasks |
| Common uses | Statistical analysis, visualization, and reports | Automation, machine learning, and software products |
| Packages for data analysis | tidyverse, ggplot2 | pandas, NumPy, scikit-learn |
Automation: code repeats a routine task with little manual work—for example, collecting and cleaning new data each week.
Machine learning (ML): a computer learns patterns from data and uses them to predict new outcomes—for example, with a decision tree.
Remember: these are common strengths, not strict limits.
Both languages can collect, clean, model, visualize, and support machine-learning workflows.
▶️ R vs. Python: IBM overview
🎯 Choose for the task, team, and destination
- Task: Is the center of the work statistical analysis and reporting, or automation and app development?
- Team: Which language, packages, and conventions do collaborators already use?
- Destination: Will the result become a report, notebook, dashboard, model, or software production?
Our course path
DANL 101 uses R because it specializes in data analysis and visualization. The underlying concepts in R can also transfer to Python and SQL.
🧩 Code needs a working environment
RStudio + Posit Cloud
- RStudio is an integrated development environment (IDE), mainly for R, with an editor, console, plots, files, help, and debugging tools.
- Posit Cloud runs RStudio projects in a browser, so our class can use R without local setup.
Jupyter + Google Colab
- Jupyter is a development environment, mainly for Python. It combines executable code, narrative text, equations, and rich output in one document.
- Google Colab is a hosted Jupyter Notebook service that requires no setup.
Language ≠ working environment: R can run outside RStudio, and Python can run outside Jupyter.
▶️ What is GitHub?
🗂️ Git keeps project history; GitHub shares it online
Git
Records changes to project files on your computer, creating a history you can review or restore.
GitHub
Keeps an online copy of the project for sharing, collaboration, review, and publishing.
| Part | Plain-language meaning |
|---|---|
| Working directory | The project folder where you edit files. |
| Project history | Saved versions that let you review or restore earlier work. |
| GitHub copy | The online version of the project for sharing and collaboration. |
Simple flow: edit files in the working directory → save a version with Git → update the project on GitHub.