Lecture 1
Syllabus and Course Outline
January 21, 2026
Instructor
Current Appointment & Education
Name: Byeong-Hak Choe.
Assistant Professor of Data Analytics and Economics, School of Business at SUNY Geneseo.
Ph.D. in Economics from University of Wyoming.
M.S. in Economics from Arizona State University.
M.A. in Economics from SUNY Stony Brook.
B.A. in Economics & B.S. in Applied Mathematics from Hanyang University at Ansan, South Korea.
- Minor in Business Administration.
- Concentration in Finance.
Research 1: Social Media vs. Fossil Fuel Lobbying on Climate Legislation
Choe, B.-H., 2021. “Social Media Campaigns, Lobbying and Legislation: Evidence from #climatechange and Energy Lobbies.”
Question: To what extent do social media campaigns compete with fossil fuel lobbying on climate change legislation?
Data include:
- 5.0 million tweets with #climatechange/#globalwarming around the globe;
- 12.0 million retweets/likes to those tweets;
- 0.8 million Twitter users who wrote those tweets;
- 1.4 million Twitter users who retweeted or liked those tweets;
- 0.3 million US Twitter users with their location at a city level;
- Firm-level lobbying data (expenses, targeted bills, etc.).
Research 2: Measuring the Value of Statistical Life Using Big Data
Choe, B.-H. and Newbold, Steve, “Estimating the Value of Statistical Life (VSL) through Big Data”
VSL is the monetary value associated with reducing the risk of death.
- How much value would that be? How can we measure it?
- How do government agencies use the VSL to decide which policies are worth the cost when they reduce the risk of death?
Research 3: Governance Barriers to Effective Climate Finance
Choe, B.-H. and Ore-Monago, T., 2024. “Governance and Climate Finance in the Developing World”
Climate finance refers to the financial resources allocated for mitigating and adapting to climate change, including support for initiatives that reduce greenhouse gas emissions and enhance resilience to climate impacts.
- We focus on transnational financing that rich countries provide poor countries with financial resources, in order to help them adapt to climate change and mitigate greenhouse gas (GHG) emissions.
- Since the GHG emissions in developing countries are rapidly growing, it is crucial to assess the effectiveness of climate finance.
- Poor governance (e.g., legal system, rule of law, and accountability) can be significant barriers to emissions reductions.
Research 4: Climate Finance with Renegotiations
- Choe, B.-H., “Climate Finance under Limited Commitment and Renegotiations: A Dynamic Contract Approach” (2026)
- Using climate funds (e.g., the Green Climate Fund) as the main mechanism for financing developing countries, this paper studies a long-term funding relationship between a rich and a poor country.
- The parties disagree over (1) the level of funding and (2) how to allocate it between adaptation and mitigation. Commitment is limited, and contracts may be renegotiated each period with some probability.
- Main results: Less frequent renegotiation improves contract efficiency and reduces inequality between the countries.
- These findings suggest design principles for climate funds: strengthen commitment and limit renegotiation, especially as climate risks intensify.
- Using climate funds (e.g., the Green Climate Fund) as the main mechanism for financing developing countries, this paper studies a long-term funding relationship between a rich and a poor country.
Let’s Introduce Ourselves
- Now that you’ve heard a bit about me and my research, I’d like to learn about you.
- Please briefly introduce yourself:
- Your name and year (first-year, sophomore, junior, senior)
- Your major/minor (or what you are considering)
- Why you are taking DANL 310
- One topic you are interested in exploring with data this semester (sports, finance, social issues, business, etc.)
Syllabus
Course & Meeting Info
- Course: DANL 310-01 — Data Visualization and Presentation (3 credits)
- Semester: Spring 2026
- Instructor: Byeong-Hak Choe
- Email (preferred): bchoe@geneseo.edu
- Class time: MW 2:00 P.M. – 3:15 P.M.
- Class location: South 338
- Office: South 227B
- Office Hours: MWF 9:15 A.M. – 10:15 A.M. (or by appointment)
Course Website & Brightspace
Course Website (GitHub Pages)
(https://bcdanl.github.io/310)
- Lecture slides
- Classwork
- Homework
- Project resources
- Announcements
- Grades
- Assignment submissions
I will post a Brightspace announcement whenever new course materials (e.g., homework) are added to the course website.
What This Course Is About
In DANL 310, we learn how to turn data into clear, compelling communication. We will focus on:
- Visualizing many graph types (bar, scatter, line, etc.)
- Preparing and organizing data for visualization
- Styling visuals (themes, colors, fonts, annotations)
- Mapping geographic data
- Building dashboards and telling stories with data (dashboards + presentations)
Key skills you’ll build:
- Create publication-quality charts using ggplot2
- Transform and organize data for visualization (dplyr)
- Customize and refine visuals for clarity and design
- Create map visualizations and spatial summaries
- Build interactive and animated graphics
- Build a Shiny app / dashboard for storytelling
- Present insights clearly and professionally
Prerequisites
DANL 101 and DANL 210
Communication Guidelines
- I check email daily (Mon–Fri)
- Expect responses within 12–72 hours
Course Contents & Schedule
- Weeks 1–2: Portfolio website (Git, GitHub, Quarto)
- Weeks 2–8: Mastering ggplot & dplyr (+ Midterm)
- HW 1: Feb 11
- HW 2: Feb 25
- HW 3: Mar 9
- Midterm Exam: March 11 (during class time)
- Week 9: Spring Break (March 14–21)
Course Contents & Schedule
- Weeks 10–14: Various ggplot charts + interactive/animation
- HW 4: Apr 8
- HW 5: Apr 27
- GREAT Day: April 22 (no class)
- Week 15: Shiny + dashboards
- HW 6: May 6
- Week 16: Data Storytelling Presentations
- May 4
- May 6
- Week 17: Final Exam + Project Report
- Final Exam: May 11, 3:30 P.M. – 5:30 P.M.
- Project Report Due: May 14
- Final Exam: May 11, 3:30 P.M. – 5:30 P.M.
Grading
Grade components
- Attendance — 5%
- Participation — 5%
- Group Project — 20%
- Homework (total) — 20%
- Exams (total) — 50%
Important grading details
- Lowest homework score is dropped
- Total exam grade is the maximum of:
- Simple average of midterm and final, or
- Weighted average (33% midterm / 67% final)
Grading Data Storytelling Project
- Peer evaluation on presentation: 5%
- Instructor evaluation: 95%
- Descriptive statistics (5%)
- Data transformation (5%)
- Data visualization (20%)
- Data storytelling (20%)
- Presentation slides (10%)
- Presentation (30%)
- Code (10%)
- Descriptive statistics (5%)
Course Policies
- Late work: Homework is accepted up to 3 days late with a 30% penalty.
- Make-up exams are allowed only with documented excuses or university-excused absences.
- Attendance is taken with a sign-in sheet
- You must email me before missing class for illness or other valid reasons
- You have 5 unexcused absences available in the semester
- Beyond that, your total percentage grade may be reduced
Academic integrity & AI use
- Cheating and plagiarism violate college policy and may result in serious consequences.
- You may use AI tools (e.g., ChatGPT, Gemini) to support your learning, but you must:
- Disclose AI use when it meaningfully contributes to your work
- Cite/attribute AI-generated material appropriately
- Using AI without disclosure/citation may be treated as academic dishonesty
- Disclose AI use when it meaningfully contributes to your work
- There is no penalty for using AI on Homework and the Data Storytelling Project.
- However, you are still responsible for understanding, verifying, and being able to explain any AI-assisted work.
Accessibility
SUNY Geneseo is committed to equitable access. If you have approved accommodations, please coordinate through OAS and communicate with me early.
Course Tools
Useful Keyboard Shortcuts for Lecture Slides
- CTRL + Shift + F: Search
- M: Toggle menu
- E: PDF export/printing mode
Let’s Practice Markdown!
Markdown is a lightweight writing format that lets you create well-structured documents using plain text (headings, lists, links, quotes, images, and code blocks).
Why Markdown is widely used on the internet:
- Works everywhere: supported by many platforms, including Quarto, Jupyter Notebook, GitHub, Reddit, Slack/Discord/Obsidian, and documentation websites.
- Great for publishing and future-proof: Markdown can be converted into professional webpages/PDFs, and because it is plain text, and it is easy to store and reuse.
In this course, Markdown is essential because you will write narrative explanations in Quarto (
*.qmd) when creating your Data Storytelling Report.Start here: Classwork 1
Getting Started with Quarto
What is Quarto?
- Quarto is an open-source publishing system for writing data-driven documents in one place.
- You write a single
.qmdfile that combines:- Markdown (text + formatting)
- Code chunks (Python / R) + output (tables, plots, results)
- Quarto can render your work into many formats:
- HTML reports, PDF, Word
- Slides (Revealjs, PowerPoint)
- Websites and books
- Quarto Gallery provides some examples.
✅ Big idea
Write once → render anywhere
Anatomy of a Quarto (.qmd) File
- A Quarto document typically has:
- YAML header (document settings)
- Markdown content (headings, text, lists, images)
- Code chunks (analysis + output)
- Everything lives in the same file, which helps keep your work reproducible.
YAML Metadata (Document Settings)
- A YAML header is surrounded by
--- - YAML controls the document configuration:
- title, author, date
- output format (HTML, PDF, Revealjs, …)
- theme, layout, options, etc.
- Code chunks are surrounded by triple backticks:
```(start chunk)```(end chunk)
Rendering (How Quarto Produces Output)
The Render button (command/Ctrl + shift + K) renders a current Quarto document.
Shortcut (Mac: option + command + I; Windows: Alt + Ctrl + I) inserts a code chunk.
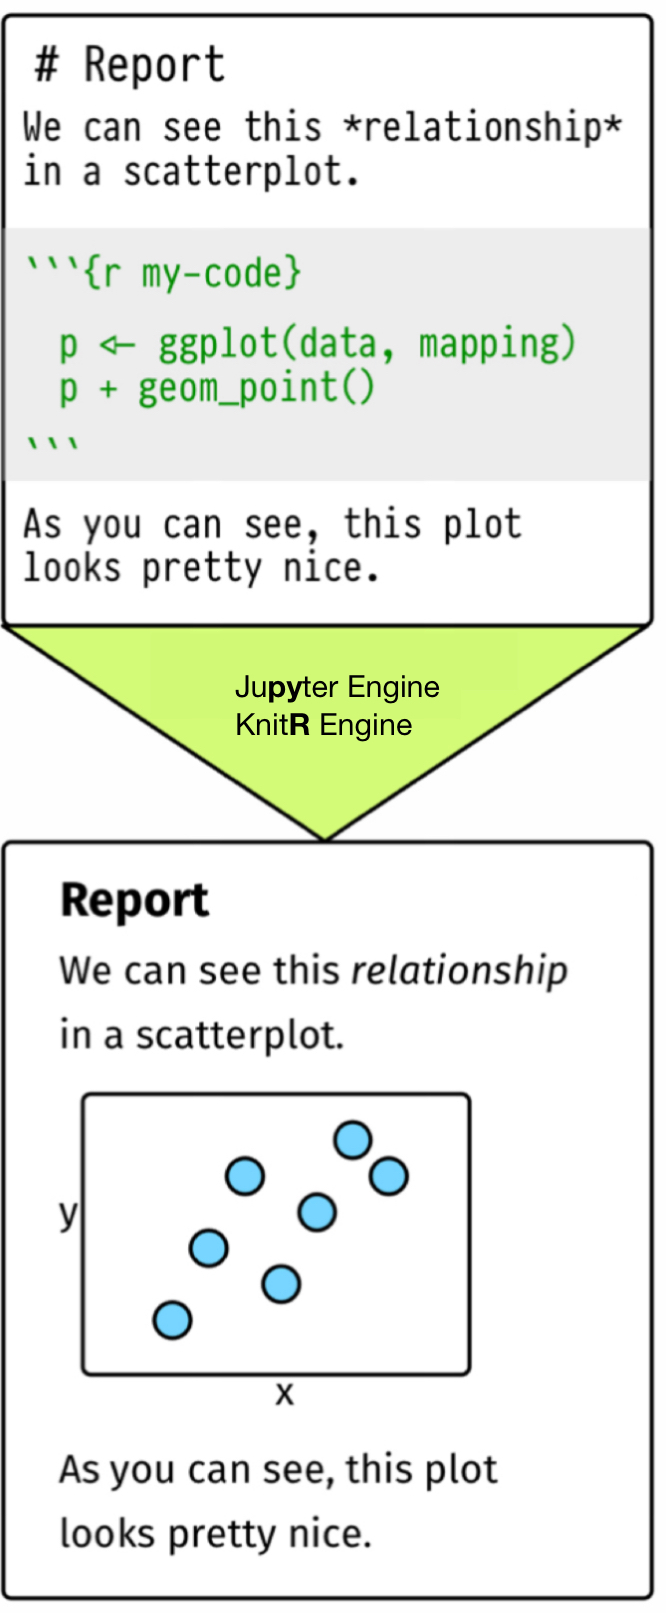
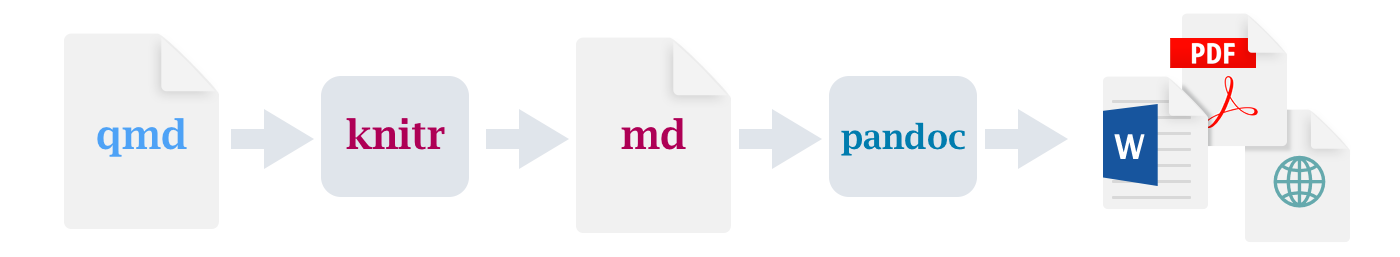
When we render a
.qmdfile, Quarto:- sends code chunks to knitr (R) or Jupyter (Python)
- collects the outputs (results, tables, figures)
- creates an intermediate Markdown document (
.md)
Then Pandoc converts that Markdown into the final output file:
- HTML, PDF, Word, slides, etc.
Example: YAML for an HTML Document
- To create an HTML document, set
format: htmlin YAML.- Many Quarto documents use HTML by default.
- In RStudio:
- File → New File → Quarto Document
- Start from an empty template and edit the YAML.
Quarto Basics (Common YAML Template)
Download the Quarto file,
danl-310-quarto-r.qmdfrom the Course Files module in Brightspace, and open it from RStudio.This block is YAML metadata:
- Indentation matters in YAML!
- Use 2 spaces consistently (recommended)
- A deeper indent means a deeper “level” in the settings