library(tidyverse)
library(skimr)
library(ggthemes)
library(ggmap)
library(ggimage)
library(ggrepel)

library(sf)
library(showtext)
font_add_google("Roboto", "roboto")
font_add_google("Lato", "lato")
font_add_google("Poppins", "poppins")
font_add_google("Nunito", "nunito")
font_add_google("Annie Use Your Telescope", "annie")
font_add_google("Pacifico", "pacifico")
showtext_auto() # Enables Google fonts in R plots.Classwork 12
Map Visualization II
Loading R packages
Part 1. NYC dog bites with geom_sf()
The following dataset is for Question 1:
# GeoPackage file (.gkpg), a modern format for map data
nyc_zips_sf <- st_read("https://bcdanl.github.io/data/nyc_zips_sf.gkpg")  # sf format
Reading layer `nyc_zips_sf' from data source
`https://bcdanl.github.io/data/nyc_zips_sf.gkpg' using driver `GPKG'
Simple feature collection with 262 features and 11 fields
Geometry type: POLYGON
Dimension: XY
Bounding box: xmin: -74.25576 ymin: 40.49584 xmax: -73.6996 ymax: 40.91517
Geodetic CRS: WGS 84nyc_dog_bites <- read_csv("https://bcdanl.github.io/data/nyc_dog_bites_all.csv") nyc_dog_license <- read_csv(
'https://bcdanl.github.io/data/nyc_dog_license.csv')- Plot a ZIP code level map of dog bite rate. \[ \text{Dog Bite Rate} = \frac{\text{Number of dog bites}}{\text{Number of dogs}} \]
Answer:
Part 2. Google Map Routes (if you)
- Setting up Google Maps API key:
# library(gmapsdistance)
google_api <- "YOUR_GOOGLE_MAP_API"

register_google(google_api) # for the ggmap package
# set.api.key(google_api) # for the gmapsdistance package- Plot a Google Map of Manhattan showing the following three routes:
route1 <- route(
  from = "Central Park, NYC",
  to   = "Empire State Building, NYC",
  mode = "driving",
  structure = "route"
)

route2 <- route(
  from = "Empire State Building, NYC",
  to   = "Times Square, NYC",
  mode = "driving",
  structure = "route"
)

route3 <- route(
  from = "Times Square, NYC",
  to   = "Central Park, NYC",
  mode = "driving",
  structure = "route"
)- In your map:
- Include a legend identifying each route;
- Mark both origins and destinations with distinct points;
- Add labels to clearly indicate each origin and destination.
Show answer
route1 <- route1 |>
  mutate(label = 1)
route2 <- route2 |>
  mutate(label = 2)
route3 <- route3 |>
  mutate(label = 3)

routes <- rbind(route1, route2, route3)
locations <- geocode(
c("Central Park, NYC",
"Empire State Building, NYC",
"Times Square, NYC")
) |>
mutate(
label =
c("Central Park",
"Empire State Building",
"Times Square")
)NYC_Map <- get_map("Time Square, NYC",
source = "google",
api_key = apiKey,
zoom = 13)
ggmap(NYC_Map) +
theme_map() 
icon_url <- "https://bcdanl.github.io/lec_figs/marker-icon-red.png"

ggmap(NYC_Map) +
  geom_image(data = locations,
             aes(x = lon, y = lat),
             image = icon_url) +
  geom_path(data = routes,
            aes(x = lon,
                y = lat,
                color = label),
            size = rel(2),
            show.legend = F) +
  geom_label_repel(data = locations,
                  aes(x = lon, y = lat,
                      label = label),
                  box.padding = 1.5,
                  alpha = .75,
                  family = 'pacifico') +
theme_map() 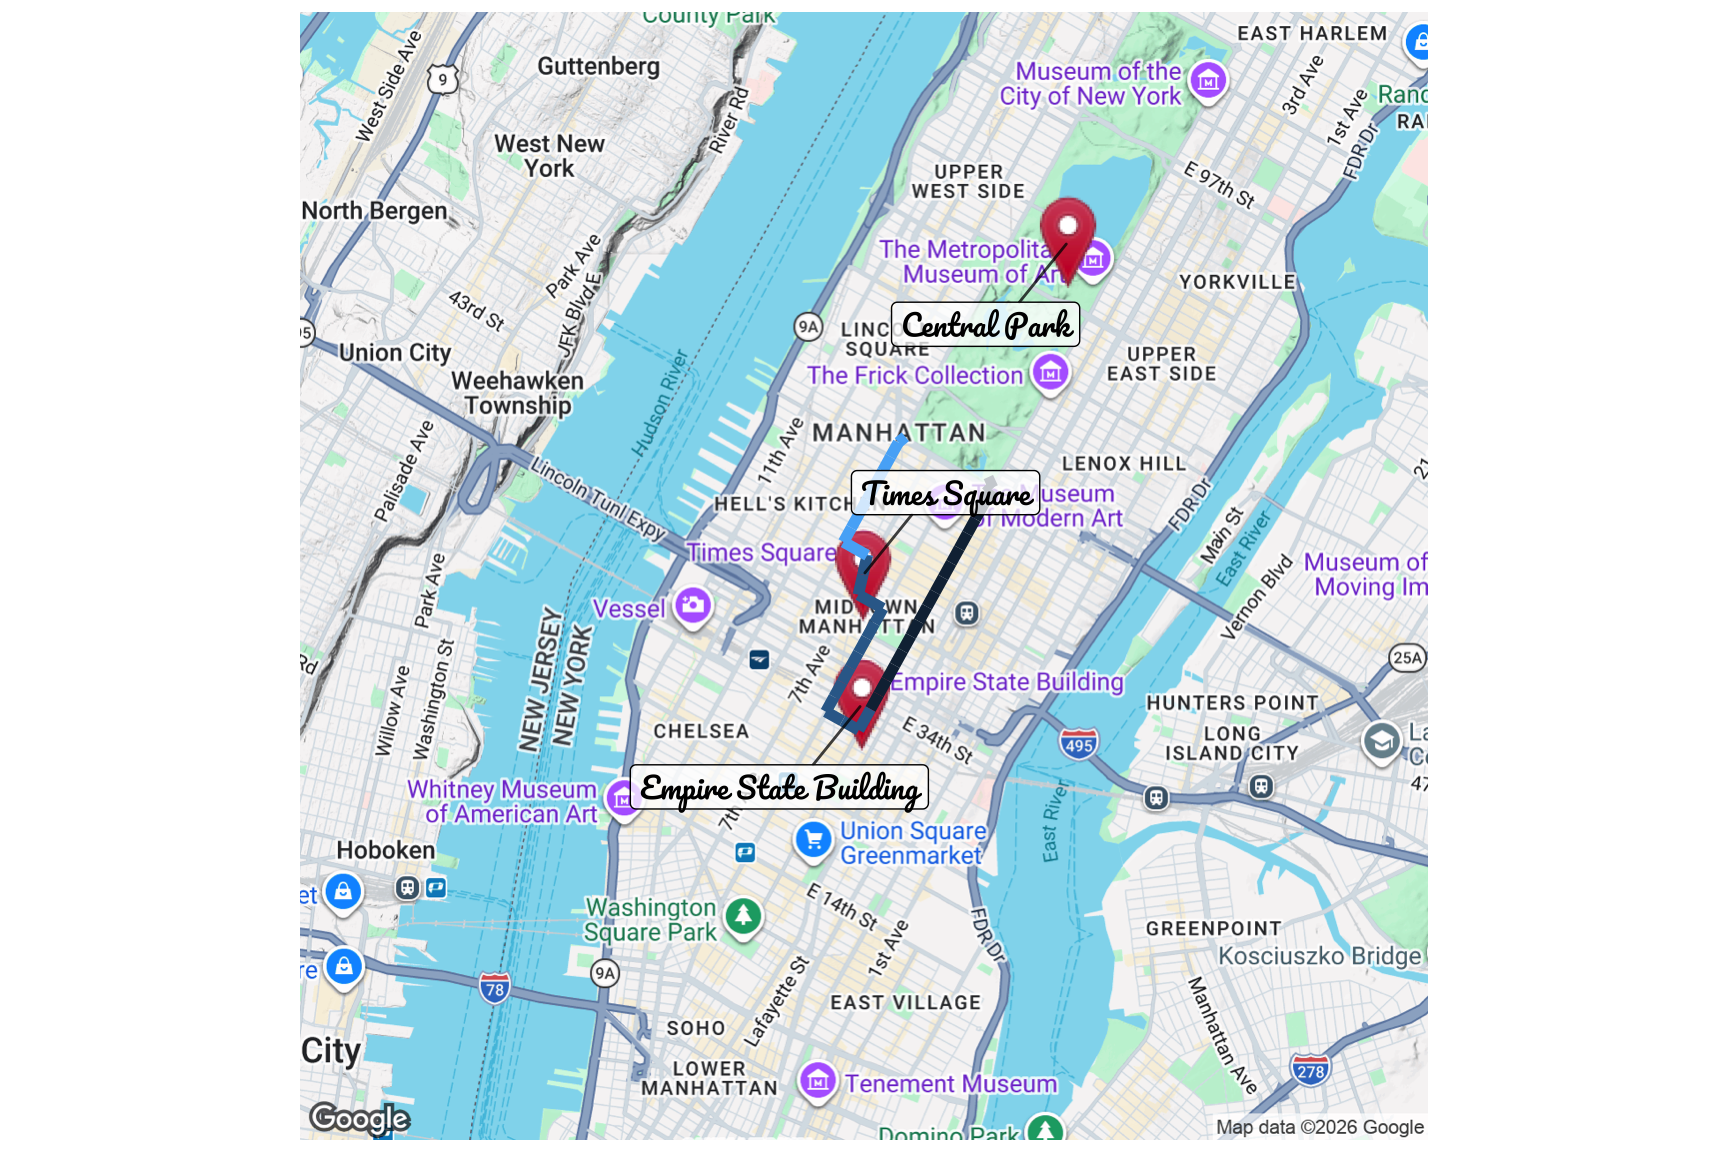
Discussion
Welcome to our Classwork 12 Discussion Board! 👋
This space is designed for you to engage with your classmates about the material covered in Classwork 12.
Whether you are looking to delve deeper into the content, share insights, or have questions about the content, this is the perfect place for you.
If you have any specific questions for Byeong-Hak (@bcdanl) regarding the Classwork 12 materials or need clarification on any points, don’t hesitate to ask here.
All comments will be stored here.
Let’s collaborate and learn from each other!