ice_cream <- read_csv("https://bcdanl.github.io/data/ben-and-jerry-cleaned.csv")Let’s analyze the starwars data:
rmarkdown::paged_table(ice_cream) Variable Description for ice_cream data.frame
The following describes the variables in the ice_cream data.frame.
…
ice_cream |>
skim()| Name | ice_cream |
| Number of rows | 21974 |
| Number of columns | 17 |
| _______________________ | |
| Column type frequency: | |
| character | 4 |
| logical | 8 |
| numeric | 5 |
| ________________________ | |
| Group variables | None |
Variable type: character
| skim_variable | n_missing | complete_rate | min | max | empty | n_unique | whitespace |
|---|---|---|---|---|---|---|---|
| flavor_descr | 0 | 1 | 3 | 30 | 0 | 50 | 0 |
| size1_descr | 0 | 1 | 9 | 9 | 0 | 2 | 0 |
| region | 0 | 1 | 4 | 7 | 0 | 4 | 0 |
| race | 0 | 1 | 5 | 5 | 0 | 4 | 0 |
Variable type: logical
| skim_variable | n_missing | complete_rate | mean | count |
|---|---|---|---|---|
| usecoup | 0 | 1 | 0.11 | FAL: 19629, TRU: 2345 |
| married | 0 | 1 | 0.60 | TRU: 13276, FAL: 8698 |
| hispanic_origin | 0 | 1 | 0.05 | FAL: 20919, TRU: 1055 |
| microwave | 0 | 1 | 0.98 | TRU: 21567, FAL: 407 |
| dishwasher | 0 | 1 | 0.77 | TRU: 16983, FAL: 4991 |
| sfh | 0 | 1 | 0.73 | TRU: 16076, FAL: 5898 |
| internet | 0 | 1 | 0.84 | TRU: 18529, FAL: 3445 |
| tvcable | 34 | 1 | 0.64 | TRU: 13954, FAL: 7986 |
Variable type: numeric
| skim_variable | n_missing | complete_rate | mean | sd | p0 | p25 | p50 | p75 | p100 | hist |
|---|---|---|---|---|---|---|---|---|---|---|
| priceper1 | 0 | 1 | 3.31 | 0.67 | 0 | 3 | 3.34 | 3.59 | 9.48 | ▁▇▂▁▁ |
| household_id | 0 | 1 | 16612005.04 | 11685954.46 | 2000358 | 8142253 | 8401573.00 | 30183891.00 | 30440689.00 | ▂▇▁▁▇ |
| household_income | 0 | 1 | 125290.80 | 57188.36 | 40000 | 80000 | 110000.00 | 170000.00 | 310000.00 | ▇▃▅▂▁ |
| household_size | 0 | 1 | 2.46 | 1.34 | 1 | 2 | 2.00 | 3.00 | 9.00 | ▇▃▁▁▁ |
| couponper1 | 0 | 1 | 0.13 | 0.52 | 0 | 0 | 0.00 | 0.00 | 8.98 | ▇▁▁▁▁ |
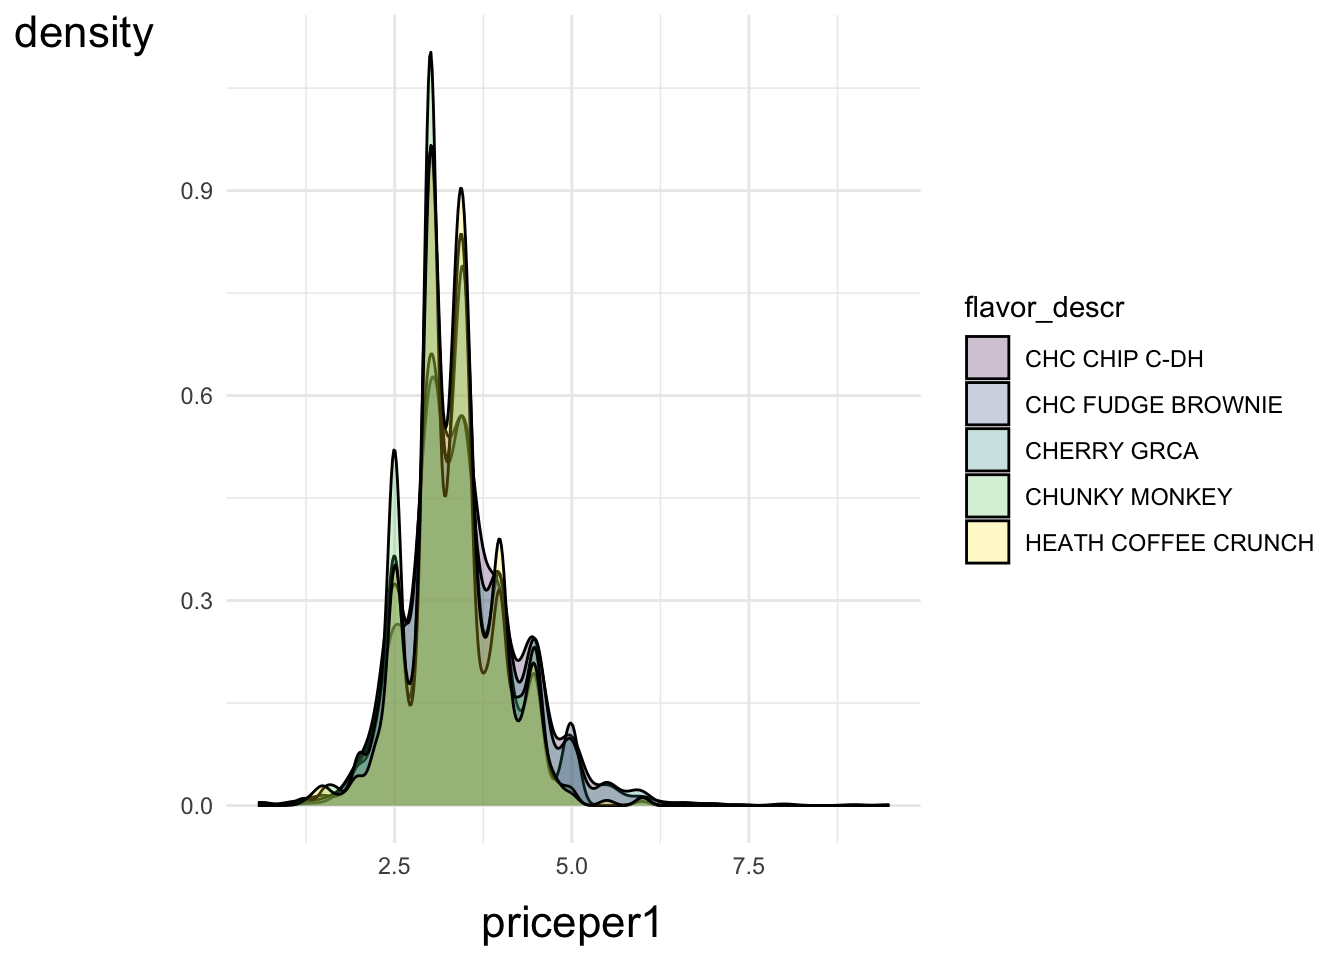
Flavor Description
flavor_desc <- ice_cream |>
  count(flavor_descr) |>
  arrange(-n)
icecream_sub <- ice_cream |>
filter(flavor_descr %in% flavor_desc$flavor_descr[1:5])
ggplot(icecream_sub,
aes(x = priceper1,
fill = flavor_descr)) +
geom_density(alpha = .25)