Lecture 25
Design with Colorblind in Mind; Facets
November 4, 2024
Design with Colorblind in Mind
Visualization Principle
Design with Colorblind in Mind

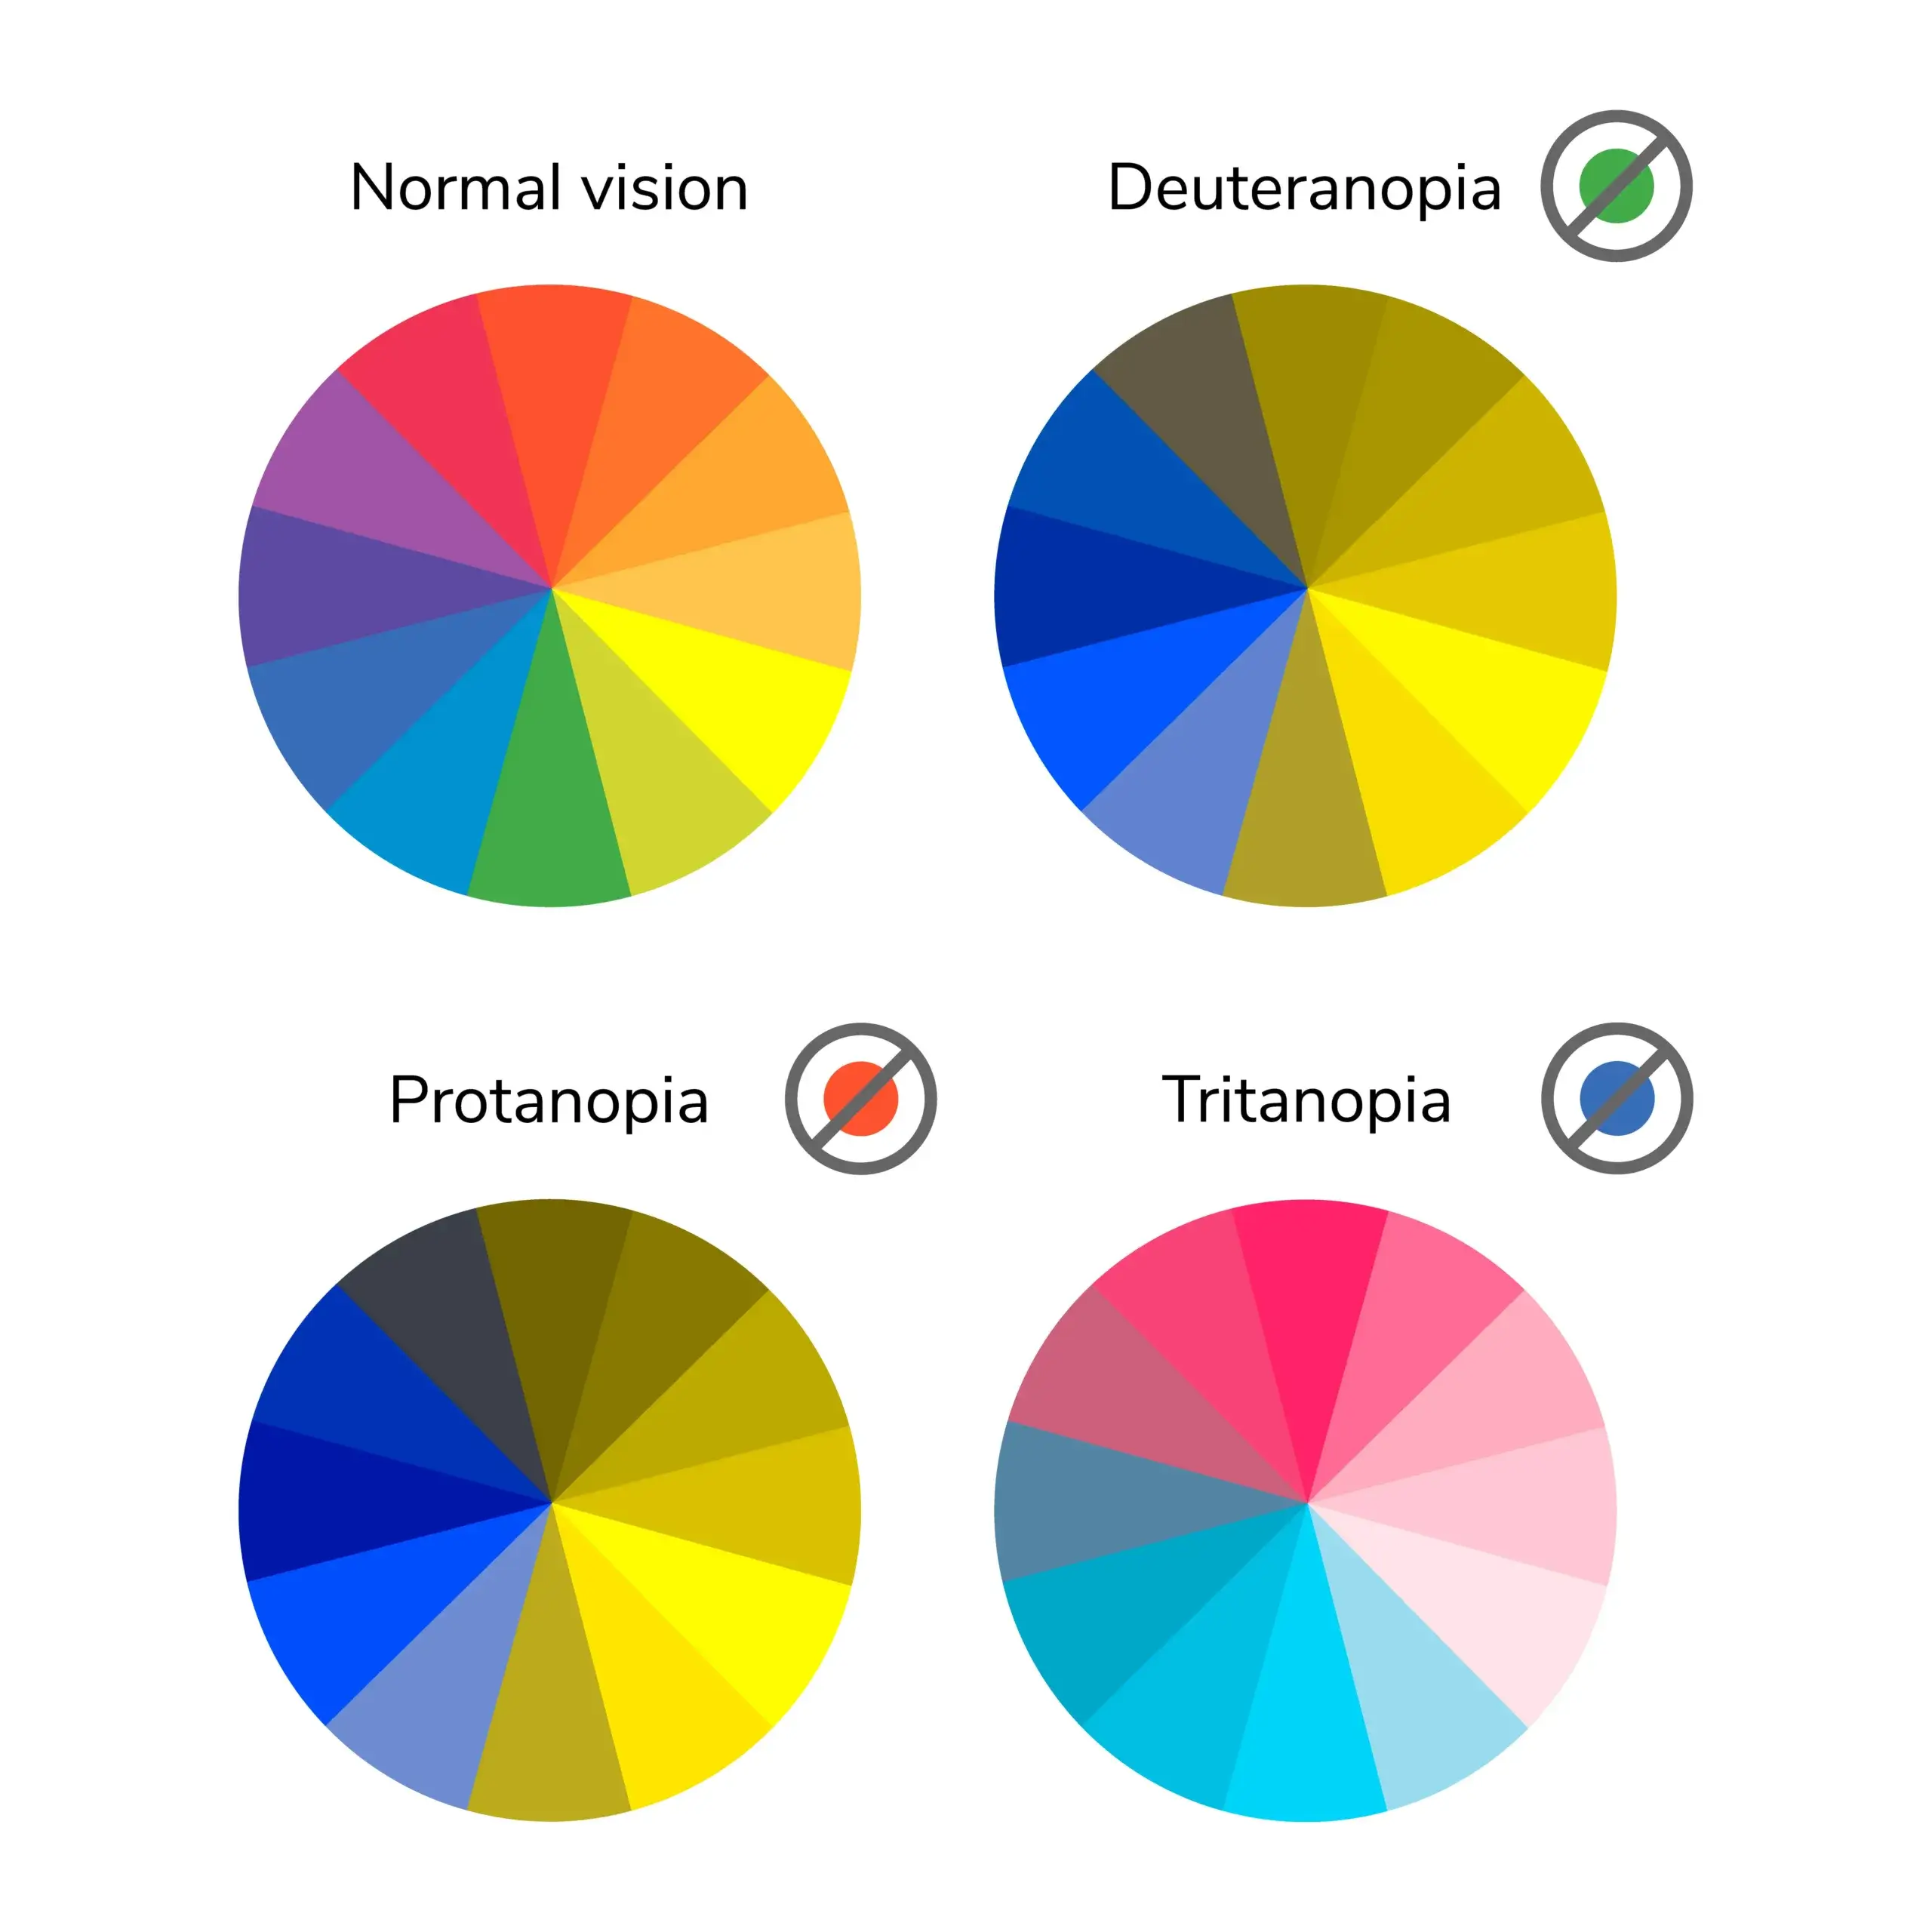
Types of Colorblindness
Roughly 8% of men and half a percent of women are colorblind.
There are several techniques to make visualization more colorblind-friendly:
- Use color palettes that are colorblind-friendly
- Use
shapefor scatterplots andlinetypefor line charts - Have some additional visual cue to set the important numbers apart
Colorblind-Friendly Color Palettes
ggthemes package
- The
ggthemespackage provides various themes forggplot2visualization:- Accessible color palettes, including those optimized for colorblind viewers.
- E.g.,
scale_color_colorblind(),scale_color_tableau()
- E.g.,
- Unique, predefined themes for specific styles
- E.g.,
theme_economist(),theme_wsj()
- E.g.,
- Accessible color palettes, including those optimized for colorblind viewers.
Colorblind-Friendly Color Palettes
ggthemes::scale_color_colorblind()

- When mapping
colorinaes(), we can usescale_color_*()
Colorblind-Friendly Color Palettes
ggthemes::scale_color_tableau()

scale_color_tableau()provides color palettes used in Tableau.
ggplot Themes
ggthemes::theme_economist()

theme_economist()approximates the style of The Economist.
ggplot Themes
ggthemes::theme_wsj()

theme_wsj()approximates the style of The Wall Street Journal.
Facets
Facets
- Adding too many aesthetics to a plot makes it cluttered and difficult to make sense of.

- One way to add a variable, particularly useful for categorical variables, is to use facets to split our plot into facets, subplots that each display one subset of the data.
Facets
facet_wrap(~ VAR)

- To facet our plot by a single variable, we can use
facet_wrap().
Facets
facet_wrap(~ VAR) with nrow

nrowdetermines the number of rows to use when laying out the facets.
Facets
facet_wrap(~ VAR) with ncol

ncoldetermines the number of columns to use when laying out the facets.
Facets
facet_wrap(~ VAR) with scales

scales = "free_x"allow for different scales of x-axis
Facets
facet_wrap(~ VAR) with scales

scales = "free_y"allow for different scales of y-axis
Facets
facet_wrap(~ VAR) with scales

scales = "free"allow for different scales of both x-axis and y-axis