Lecture 23
Aesthetic Mappings
October 30, 2024
Aesthetic Mappings
Aesthetic Mappings

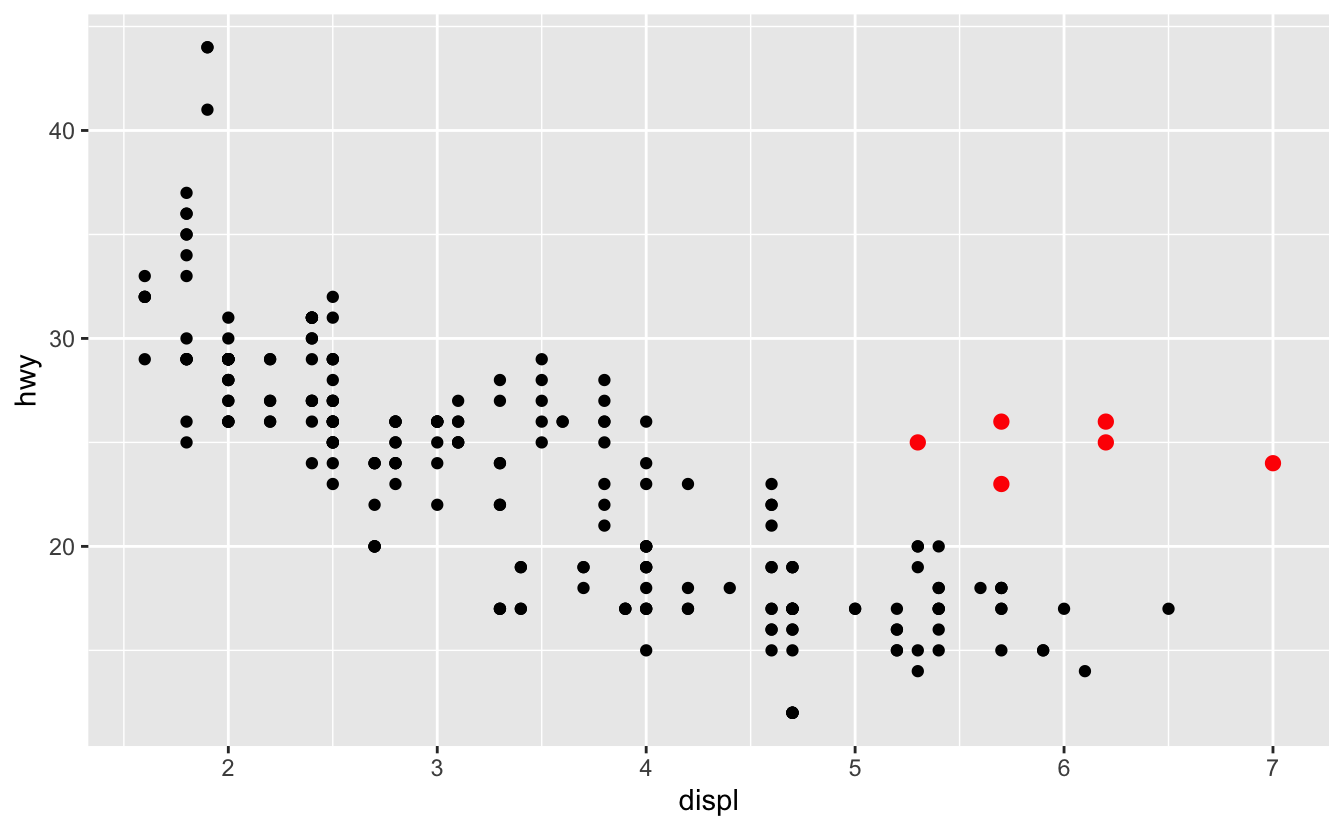
In the plot above, one group of points (highlighted in red) seems to fall outside of the linear trend.
- How can you explain these cars? Are those hybrids?
Aesthetic Mappings

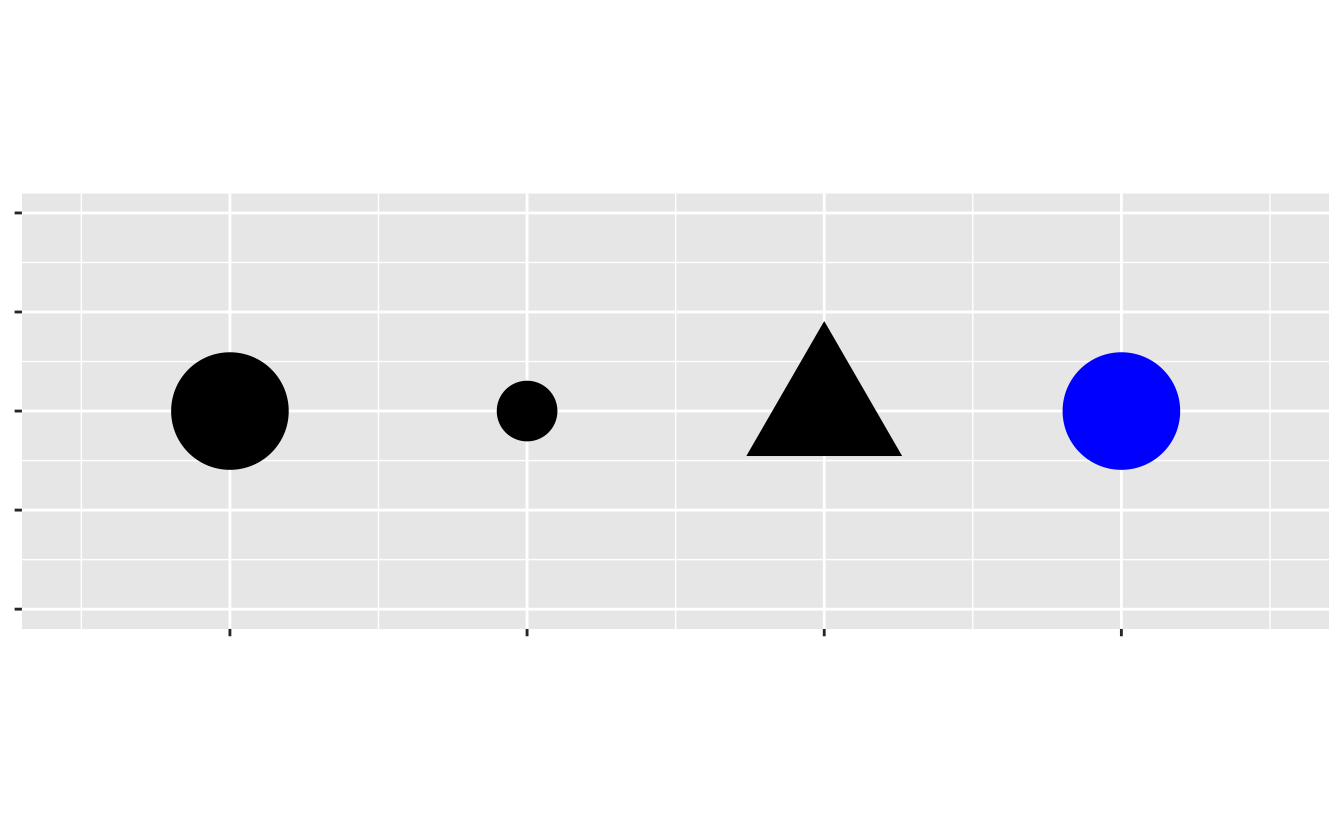
An aesthetic is a visual property (e.g.,
size,shape,color) of the objects (e.g.,class) in your plot.You can display a point in different ways by changing the values of its aesthetic properties.
Aesthetic Mappings
Adding a color to the plot
Aesthetic Mappings
Adding a shape to the plot
Aesthetic Mappings
Adding a size to the plot
Aesthetic Mappings
Specifying a color to the plot, manually
Aesthetic Mappings
Specifying an color to the plot, manually
Aesthetic Mappings
Specifying an fill to the plot, manually

- In general, each
geom_*()has a different set of aesthetic parameters.- E.g.,
fillis available forgeom_smooth(), notgeom_point().
- E.g.,
Aesthetic Mappings
Specifying a size to the plot, manually
Aesthetic Mappings
Specifying an alpha to the plot, manually
- We’ve done this to address the issue of overplotting in the scatterplot.
Aesthetic Mappings
Mapping Aesthetics vs. Setting Them Manually
Aesthetic Mapping
- Links data variables to visible properties on the graph
- Different categories → different colors or shapes
Setting Aesthetics Manually
- Customize visual properties directly in
geom_*()outside ofaes() - Useful for setting fixed colors, sizes, or transparency unrelated to data variables


