Lecture 21
Data Visualization with ggplot
October 25, 2024
Grading
\[ \begin{align} (\text{Total Percentage Grade}) =&\;\, 0.05\times(\text{Attendance}) \notag\\ &\,+\, 0.15\times(\text{Quiz & Class Participation})\notag\\ & \,+\, 0.15\times(\text{Homework})\notag\\ &\,+\, 0.15\times(\text{Presentation})\notag\\ & \,+\, 0.50\times(\text{Exam}).\notag \end{align} \]
Grading
Grading
You are allowed up to 6 absences without penalty.
- Send me an email if you have standard excused reasons (illness, family emergency, transportation problems, etc.).
For each absence beyond the initial six, there will be a deduction of 1% from the Total Percentage Grade.
The single lowest homework score will be dropped when calculating the total homework score.
- Each homework except for the homework with the lowest score accounts for 20% of the total homework score.
Grading
\[ \begin{align} &(\text{Total Exam Score}) \\ =\, &\text{max}\,\left\{0.50\times(\text{Midterm Exam Score}) \,+\, 0.50\times(\text{Final Exam Score})\right.,\notag\\ &\qquad\;\,\left.0.25\times(\text{Midterm Exam Score}) \,+\, 0.75\times(\text{Final Exam Score})\right\}.\notag \end{align} \]
- The total exam score is the maximum between
- the simple average of the midterm exam score and the final exam score and
- the weighted average of them with one-fourth weight on the midterm exam score and three-third weight on the final exam score:
Grading
\[ \begin{align} &(\text{Total Midterm Exam}) \\ =\, &\text{max}\,\left\{0.50\times(\text{Midterm Exam 1}) \,+\, 0.50\times(\text{Midterm Exam 2})\right.,\notag\\ &\qquad\;\,\left.0.25\times(\text{Midterm Exam 1}) \,+\, 0.75\times(\text{Midterm Exam 2})\right\}.\notag \end{align} \]
- The total midterm exam score is the maximum between
- the simple average of the midterm exam 1 score and the midterm exam 2 score and
- the weighted average of them with one-fourth weight on the midterm exam 1 score and three-third weight on the midterm exam 2 score:
Grading
- Scenario 1
- Suppose your \((\text{Total Exam Score})\) is taken from: \[ \begin{align} \cdot\; &0.25\times(\text{Midterm Exam 1}) \,+\, 0.75\times(\text{Midterm Exam 2})\\ \cdot\; &0.25\times(\text{Midterm Exam}) \,+\, 0.75\times(\text{Final Exam}) \end{align} \]
- \((\text{Midterm Exam 1})\) will then account for only 6.25% of your \((\text{Total Exam Score})\).
Grading
- Scenario 2
- Suppose your \((\text{Total Exam Score})\) is taken from: \[ \begin{align} &0.5\times(\text{Midterm Exam 1}) \,+\, 0.5\times(\text{Midterm Exam 2})\\ &0.25\times(\text{Midterm Exam}) \,+\, 0.75\times(\text{Final Exam}) \end{align} \]
- \((\text{Midterm Exam 1})\) will then account for only 12.5% of your \((\text{Total Exam Score})\).
Data Visualization with ggplot
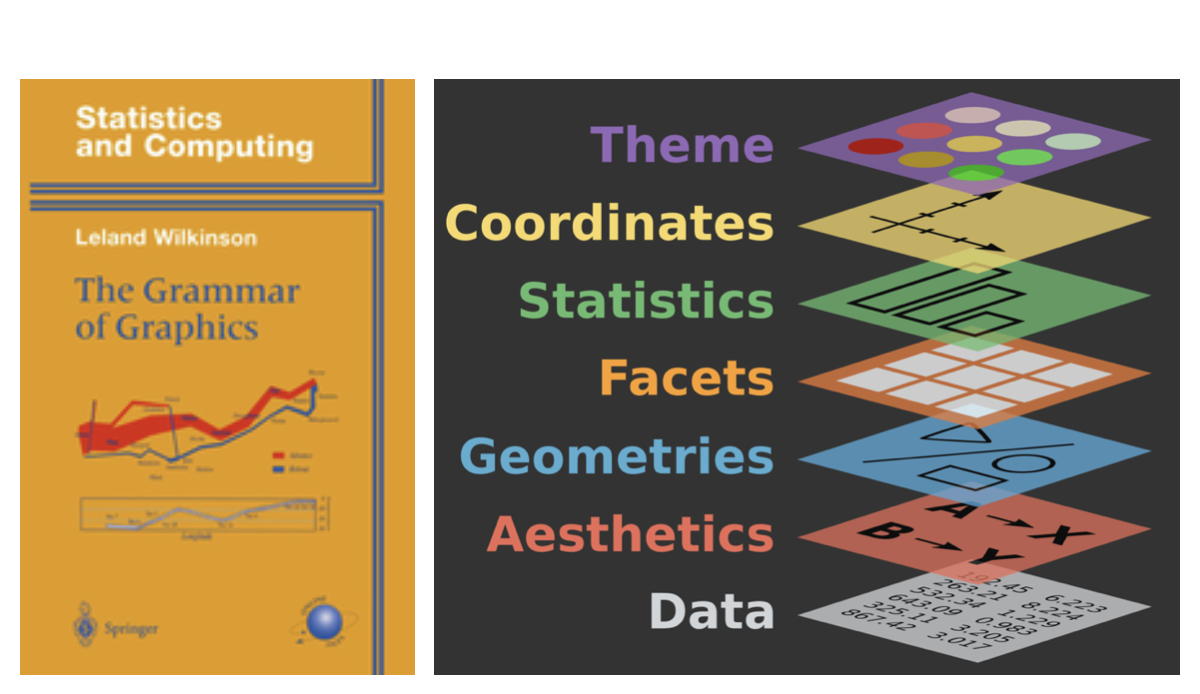
Grammar of Graphics

- A grammar of graphics is a tool that enables us to concisely describe the components of a graphic.
Data Visualization - First Steps
The
mpgdata frame, provided byggplot2, contains observations collected by the US Environmental Protection Agency on 38 models of car.Q. Do cars with big engines use more fuel than cars with small engines?
displ: a car’s engine size, in liters.hwy: a car’s fuel efficiency on the highway, in miles per gallon (mpg).
What does the relationship between engine size and fuel efficiency look like?
Data Visualization - First Steps
Creating a Scatterplot with ggplot
- To plot
mpg, run the above code to putdisplon thex-axis andhwyon they-axis.
Data Visualization - First Steps
Components in the Grammar of Graphics
A
ggplotgraphic is amappingof variables indatatoaesthetic attributes ofgeometric objects.Three Essential Components in
ggplot()Graphics:data: data.frame containing the variables of interest.geom_*(): geometric object in the plot (e.g., point, line, bar, histogram, boxplot).aes(): aesthetic attributes of the geometric object (e.g.,x-axis,y-axis,color,shape,size,fill) mapped to variables in the data.frame.
Data Visualization - First Steps
Creating a Scatterplot with ggplot
- Three Essential Components in This Particular
ggplot():data = mpggeom_point()aes(x = displ, y = hwy)
