Lecture 10
Data Preparation and Management
September 20, 2024
Data Preparation and Management
Data Management Fuels Rapid Growth
AirBnB

Airbnb attributes much of its growth from a small San Francisco startup to a $77.23 billion company (as of September 2024) to its effective use of data science and management.
The company shifted from using basic “cold numeric data” to leveraging complex data analysis for understanding individual user experiences and community trends.
Data Management Fuels Rapid Growth
AirBnB

- Airbnb developed the Dataportal, an integrated system that centralizes data resources, making it easier for employees to:
- Access and analyze data quickly
- Inform decision-making across various business aspects
- Maintain data consistency and accuracy
Data Management Fuels Rapid Growth
AirBnB

- The Dataportal solved internal data management challenges by:
- Integrating multiple data tools (tables, dashboards, reports)
- Reducing duplication of data resources
- Providing context and connections between different data sets
Data Management Fuels Rapid Growth
AirBnB

- Airbnb’s data management strategy supports:
- Improvement of its search and booking systems
- Evaluation of user experiences
- Informed decision-making in hiring, product development, and site design
Data Management Fuels Rapid Growth
AirBnB

- The company’s success in data leverage is built on three pillars:
- A robust data management program (Dataportal)
- A team of creative data scientists
- A company-wide commitment to data-driven decision-making
Big Data
Big data and analytics are likely to be significant components of future careers across various fields.
Big data refers to enormous and complex data collections that traditional data management tools can’t handle effectively.
Five key characteristics of big data (5 V’s):
- Volume
- Velocity
- Value
- Veracity
- Variety
Big Data
1. Volume
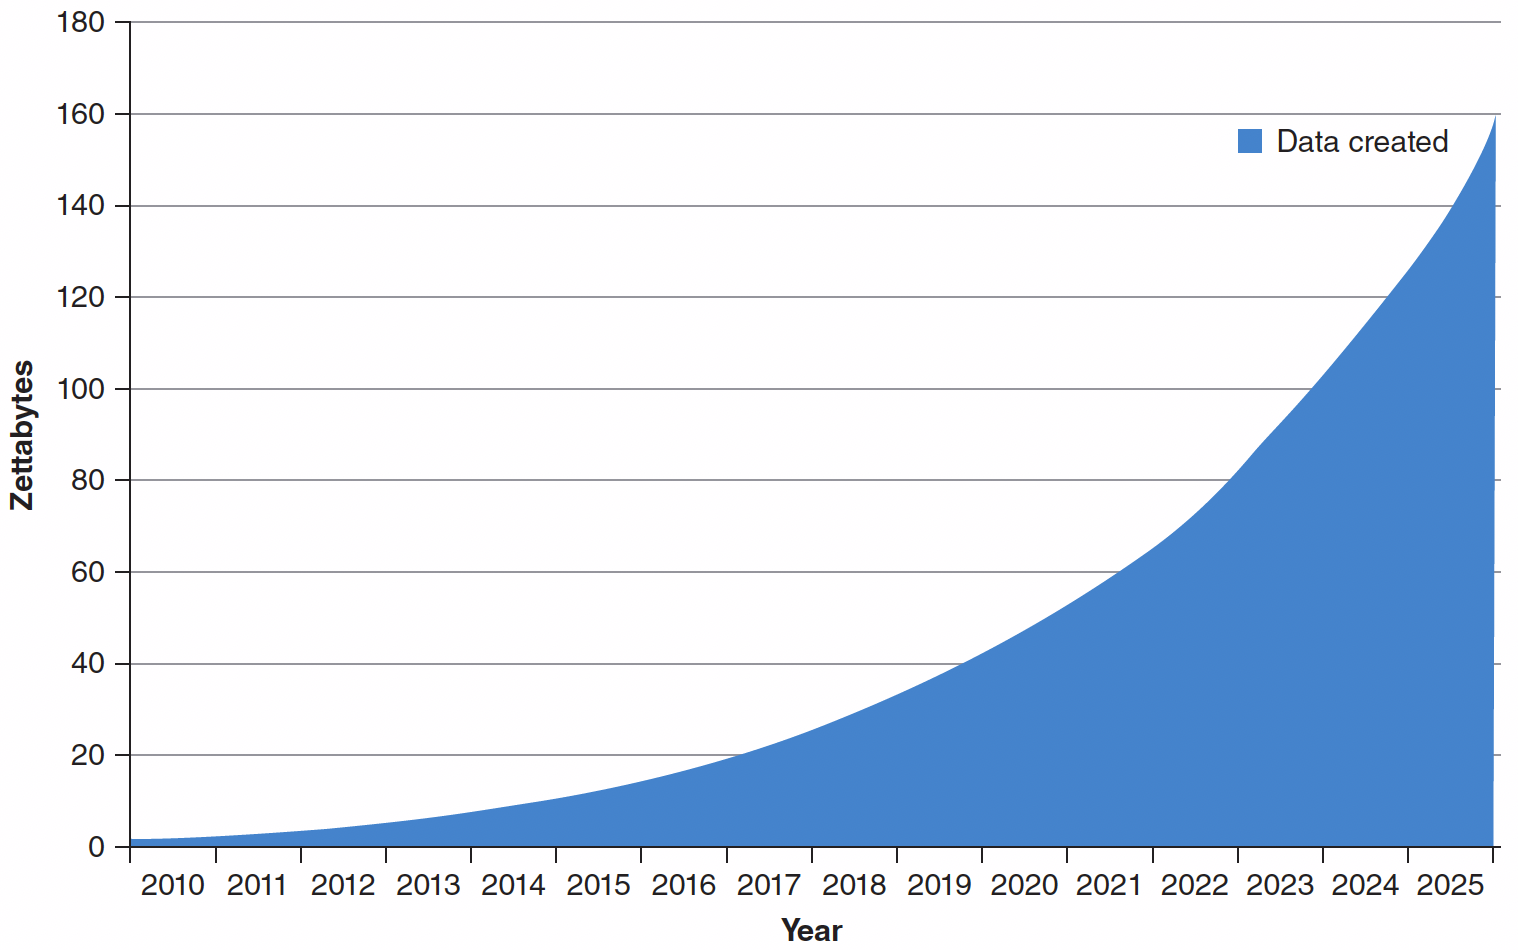
- In 2017, the digital universe contained an estimated 16.1 zettabytes of data.
- Expected to grow to 163 zettabytes by 2025.
- Much new data will come from embedded systems in smart devices.
Big Data
1. Volume
| Name | Symbol | Value |
|---|---|---|
| Kilobyte | kB | 10³ |
| Megabyte | MB | 10⁶ |
| Gigabyte | GB | 10⁹ |
| Terabyte | TB | 10¹² |
| Petabyte | PB | 10¹⁵ |
| Exabyte | EB | 10¹⁸ |
| Zettabyte | ZB | 10²¹ |
| Yottabyte | YB | 10²⁴ |
| Brontobyte* | BB | 10²⁷ |
| Gegobyte* | GeB | 10³⁰ |
Note: The asterisks (*) next to Brontobyte and Gegobyte in the original image have been preserved in this table. These likely indicate that these units are less commonly used or are proposed extensions to the standard system of byte units.

Increase in size of the global datasphere
Big Data
2. Velocity
- Refers to the rate at which new data is generated.
- Estimated at 0.33 zetabytes each day (120 zetabytes annually).
- 90% of the world’s data was generated in just the past two years.
Big Data
3. Value
- Refers to the worth of data in decision-making.
- Emphasizes the need to quickly identify and process relevant data.
- Users may be able to find more patterns and interesting anomalies from “big” data than from “small” data.
Big Data
4. Veracity
- Measures the quality of the data.
- Considers accuracy, completeness, and currency of data.
- Determines if the data can be trusted for good decision-making.
Big Data
5. Variety

- Data comes in various formats.
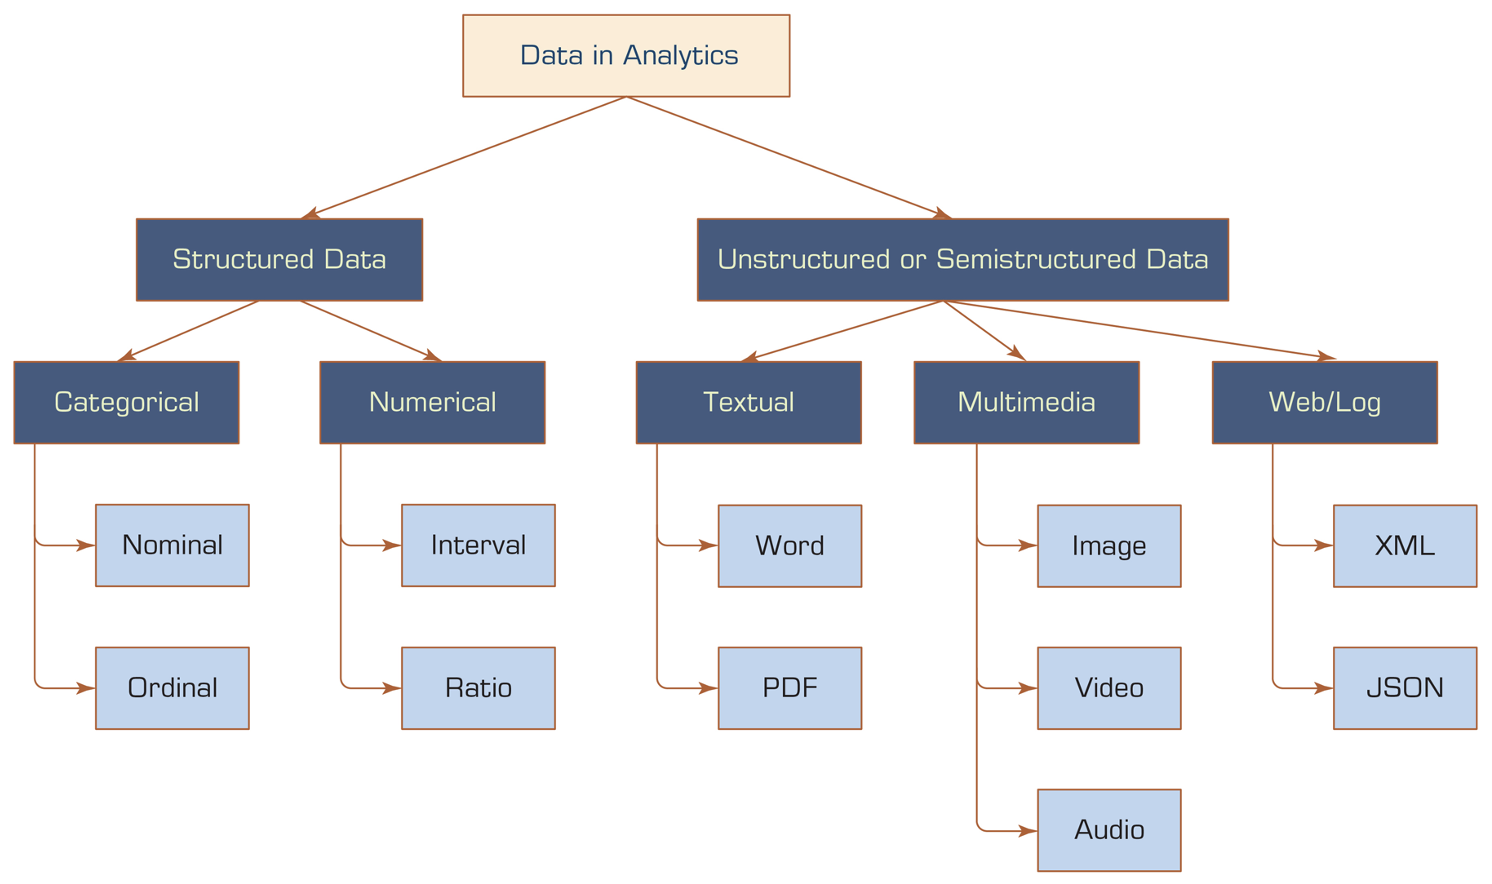
- Structured data: Has a predefined format, fits into traditional databases.
- Unstructured data: Not organized in a predefined manner, comes from sources like documents, social media, emails, photos, videos, etc.
Introduction to data.frame

- Definition: A
data.frameis a table-like data structure in R used for storing data in a tabular format with rows and columns. - Structure: Consists of:
- Variables (Columns)
- Observations (Rows)
- Values (Cells): Individual data points within each cell of the
data.frame.
Introduction to data.frame
Variables
- Definition: Columns in a
data.frame, representing a specific attribute or characteristic measured across different units of observation. - Examples:
- Student Data:
Name,Age,Grade,Major - Employee Data:
EmployeeID,Name,Age,Department
- Student Data:
Introduction to data.frame
Observations
- Definition: Rows in a
data.frame, each representing a single entity or unit for which data is collected and recorded. - Examples:
- Student Information: Each row represents an individual student.
- Employee Information: Each row represents an individual employee.
- Daily S&P 500 Index Data: Each row represents a specific day.
- Household Survey Data: Each row represents a household.
A Simple Taxonomy of Data
Data Types Overview
- Categorical Data: Data that can be divided into distinct categories based on some qualitative attribute.
- Nominal Data
- Ordinal Data
- Numeric Data: Data that represents measurable quantities and can be subjected to mathematical algebra.
- Interval Data
- Ratio Data
A Simple Taxonomy of Data
Categorical Data - Nominal
| ID | Animal |
|---|---|
| 1 | Dog |
| 2 | Cat |
| 3 | Bird |
- Nominal Data: Categorical data where the categories have no intrinsic order or ranking.
- No Order: Categories are simply different; there is no logical sequence.
- Examples:
- Colors: Red, Blue, Green
- Types of Animals: Dog, Cat, Bird
A Simple Taxonomy of Data
Categorical Data - Ordinal
| ID | Education Level |
|---|---|
| 1 | Bachelor’s |
| 2 | Master’s |
| 3 | PhD |
Ordinal Data: Categorical data where the categories have a meaningful order or ranking.
Order Matters: Categories can be ranked or ordered, but the differences between categories are not necessarily uniform.
Examples:
- Education Levels: High School, Bachelor’s, Master’s, PhD
- Customer Satisfaction: Poor, Fair, Good, Excellent
A Simple Taxonomy of Data
Numeric Data - Interval
| ID | Temperature (°F) |
|---|---|
| 1 | 70 |
| 2 | 80 |
| 3 | 90 |
Interval Data: Numeric data where the differences between values are meaningful, but there is no true zero point.
Meaningful Intervals: The difference between values is consistent.
No True Zero: Zero does not indicate the absence of the quantity.
Examples:
- Temperature (°F): Zero degrees does not mean no temperature.
- Time of Day in a 12-Hour Clock: Differences are meaningful, but there is no absolute zero.
A Simple Taxonomy of Data
Numeric Data - Ratio
| ID | Height (cm) | Weight (kg) |
|---|---|---|
| 1 | 160 | 55 |
| 2 | 175 | 70 |
| 3 | 170 | 65 |
Ratio Data: Numeric data with a true zero point, allowing for a full range of mathematical operations.
Meaningful Ratios: Comparisons like twice as much or half as much are valid.
True Zero: Zero indicates the absence of the quantity.
Examples:
- Height in Centimeters: Zero means no height.
- Weight in Kilograms: Zero means no weight.
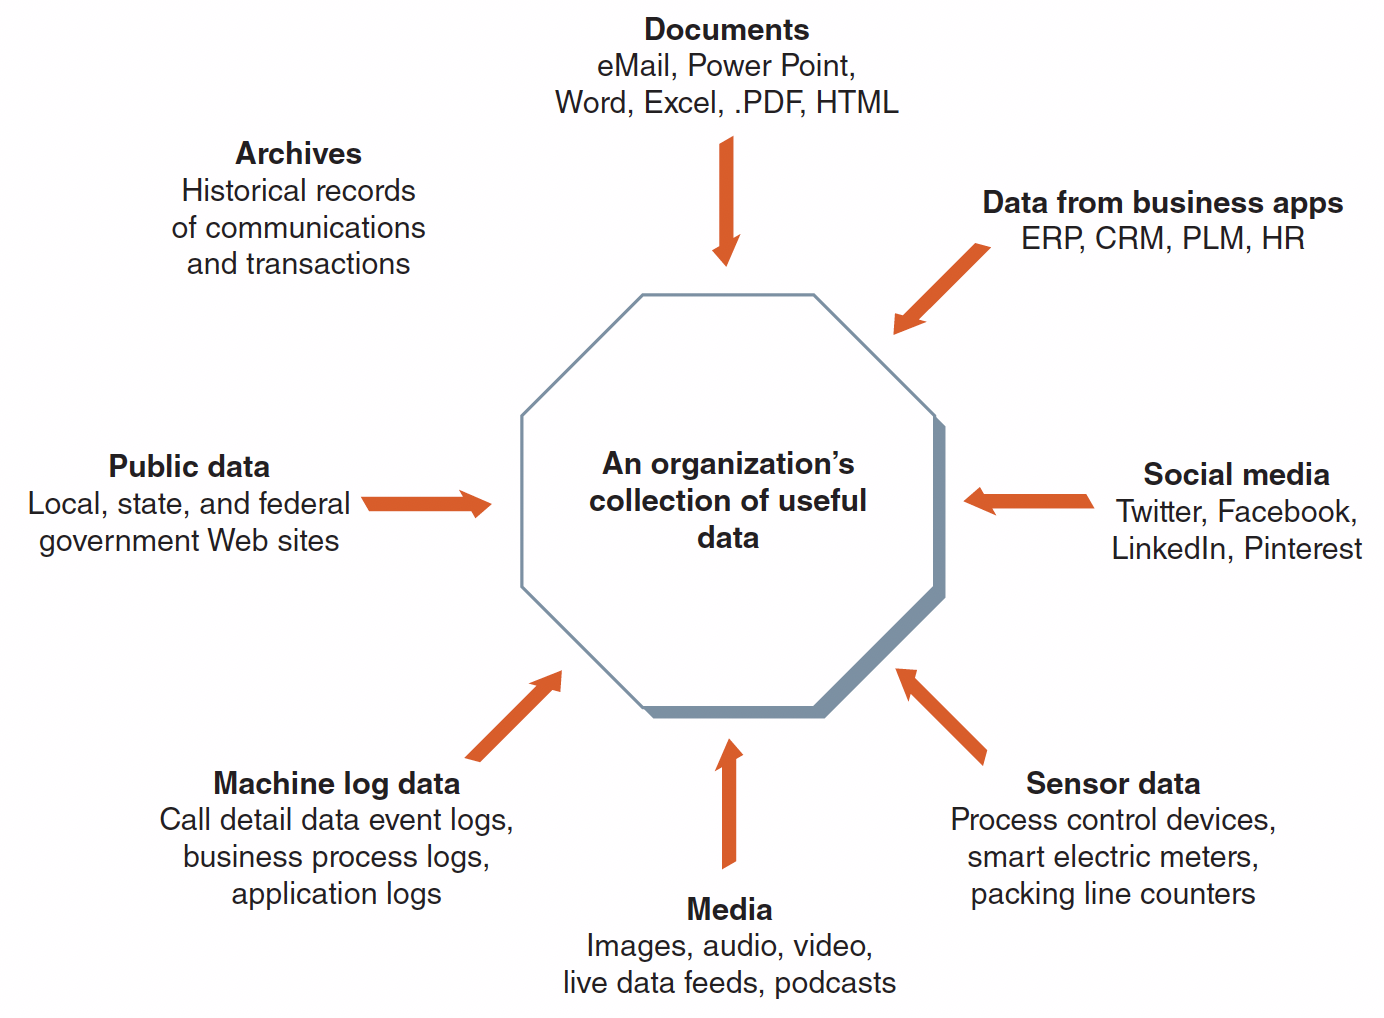
Sources of an Organization’s Data
