Lecture 3
Sports Analytics; Business Intelligence
September 3, 2025
Sports Analytics
Moneyball’s Impact


- The use of data analytics for sports was popularized by the Moneyball book by Michael Lewis in 2003 and the movie starring Brad Pitt and Jonah Hill in 2011.
1. Fan Analytics
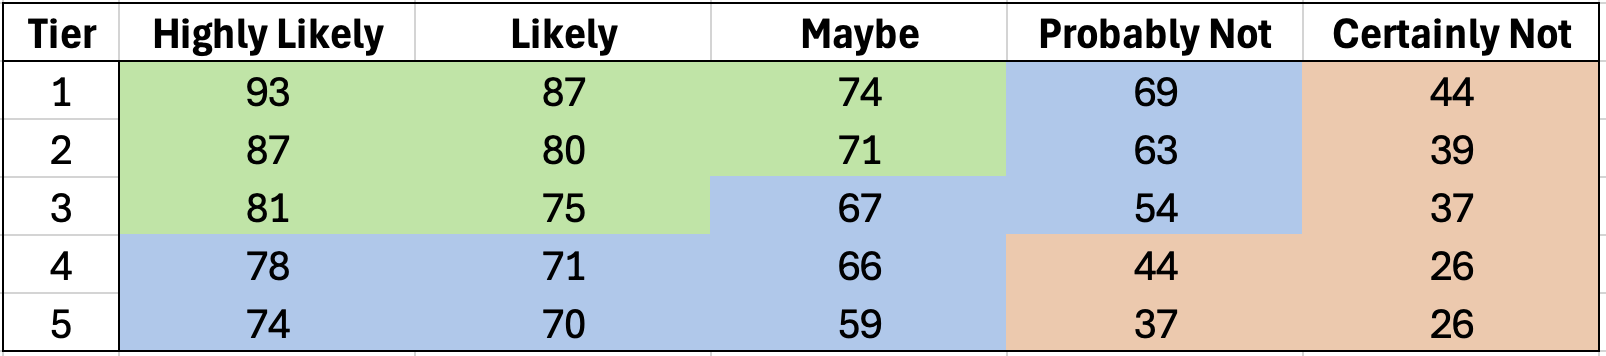
Season Ticket Renewals—Likelihood to Purchase Again
e.g., 69% of fans in Tier 1 seats who said on the survey that they would “probably not” renew actually did.
The types of questions for fan analytics would be:
- How can we best allocate our marketing efforts using insights from the survey?
- Why do season ticket holders renew their tickets?
- What factors drive last-minute individual seat ticket purchases?
- How to price the tickets?
1. Fan Analytics
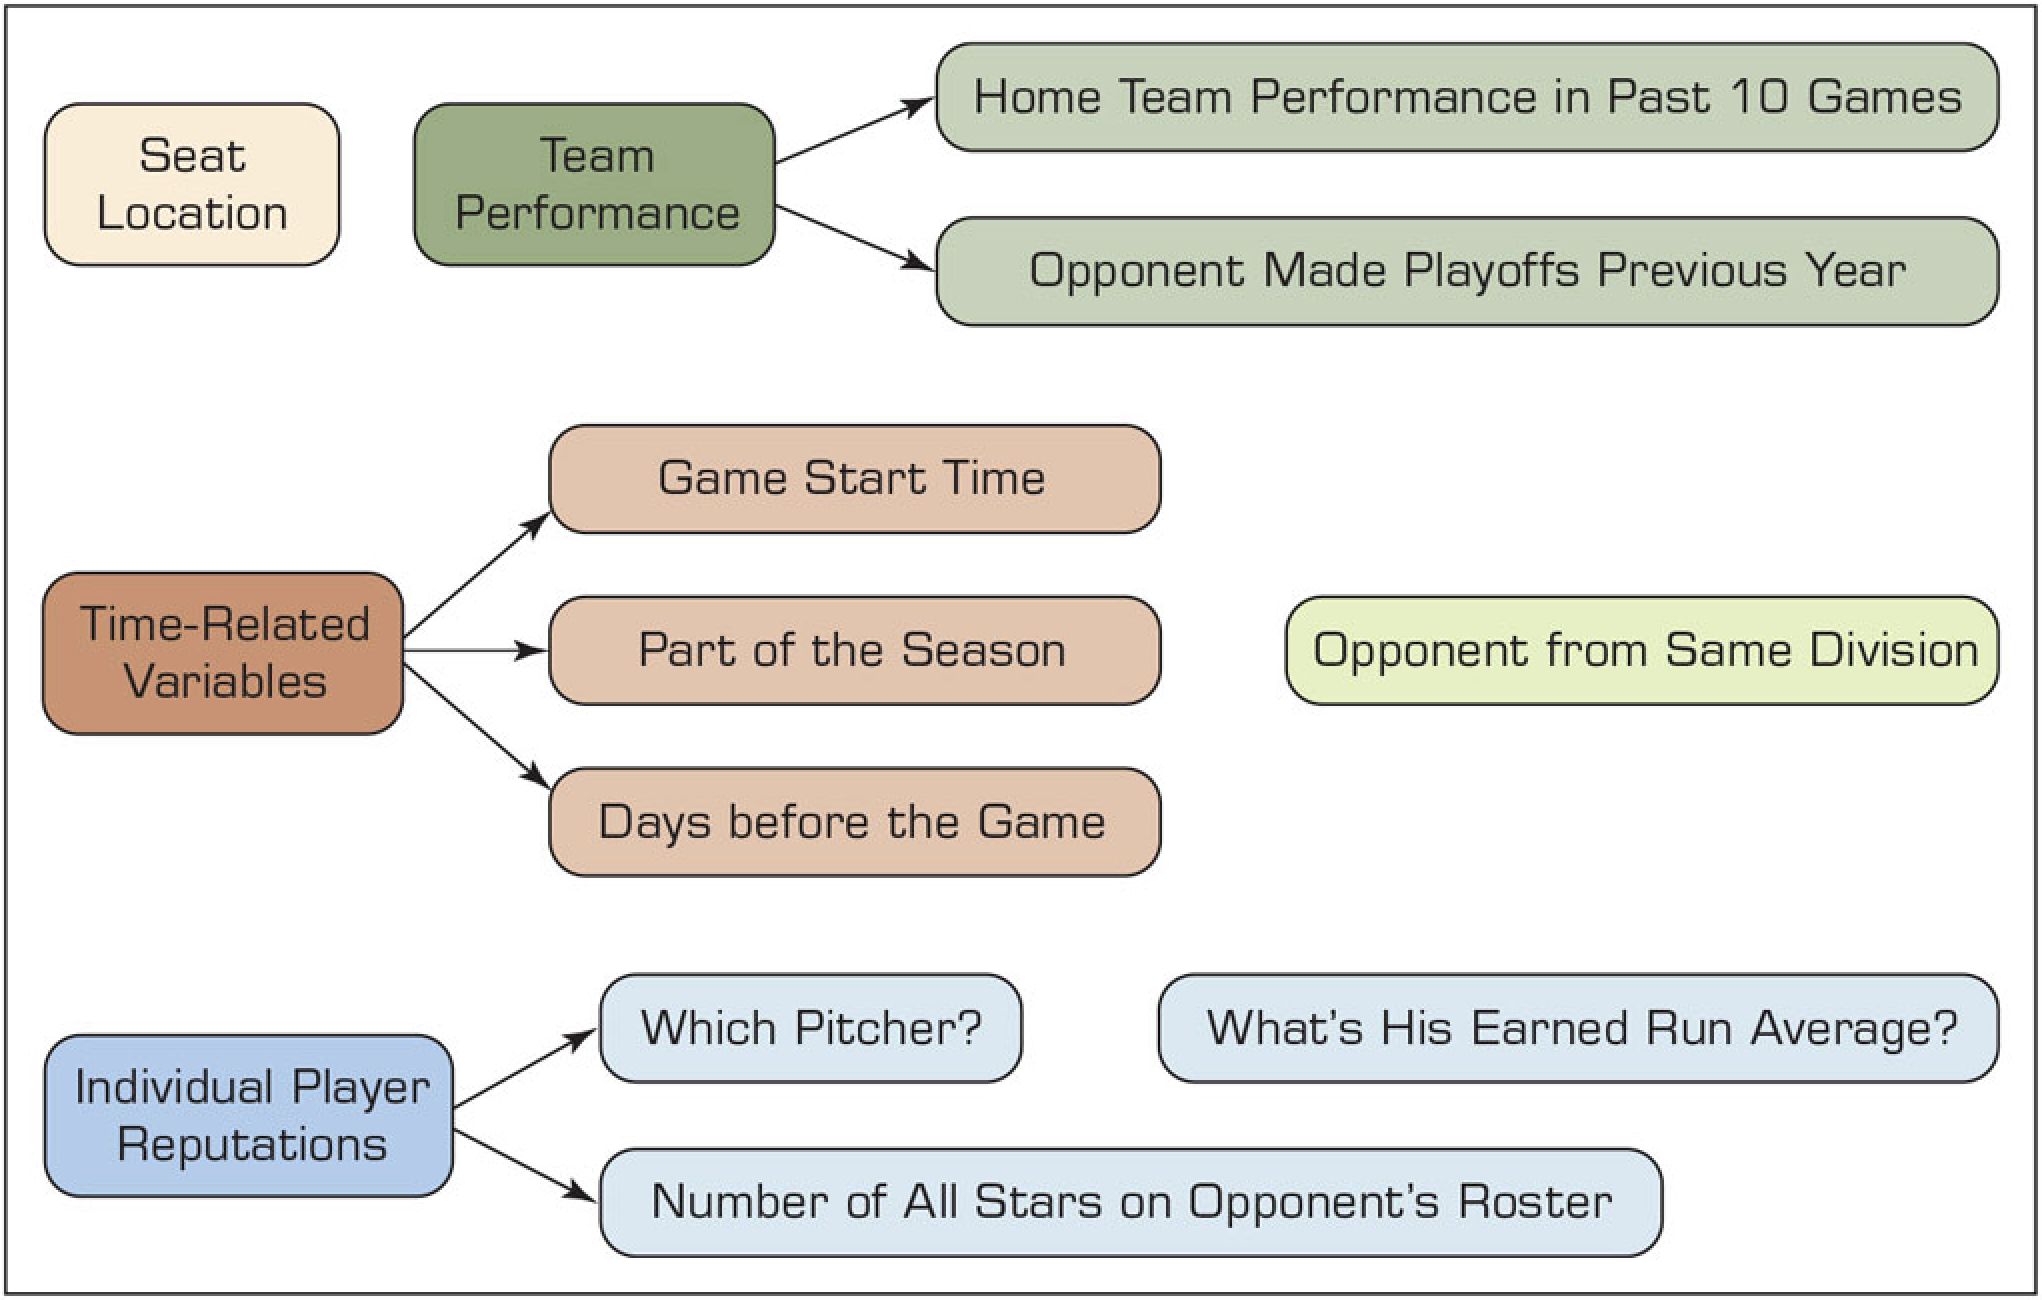
- Business offices at sports team do dynamic pricing:
- It adjusts ticket prices based on various factors such as the team’s performance, opponent, game time, and real-time data like weather and traffic.
2. Team Tactics
Decision Tree for Run or Pass Plays in Football
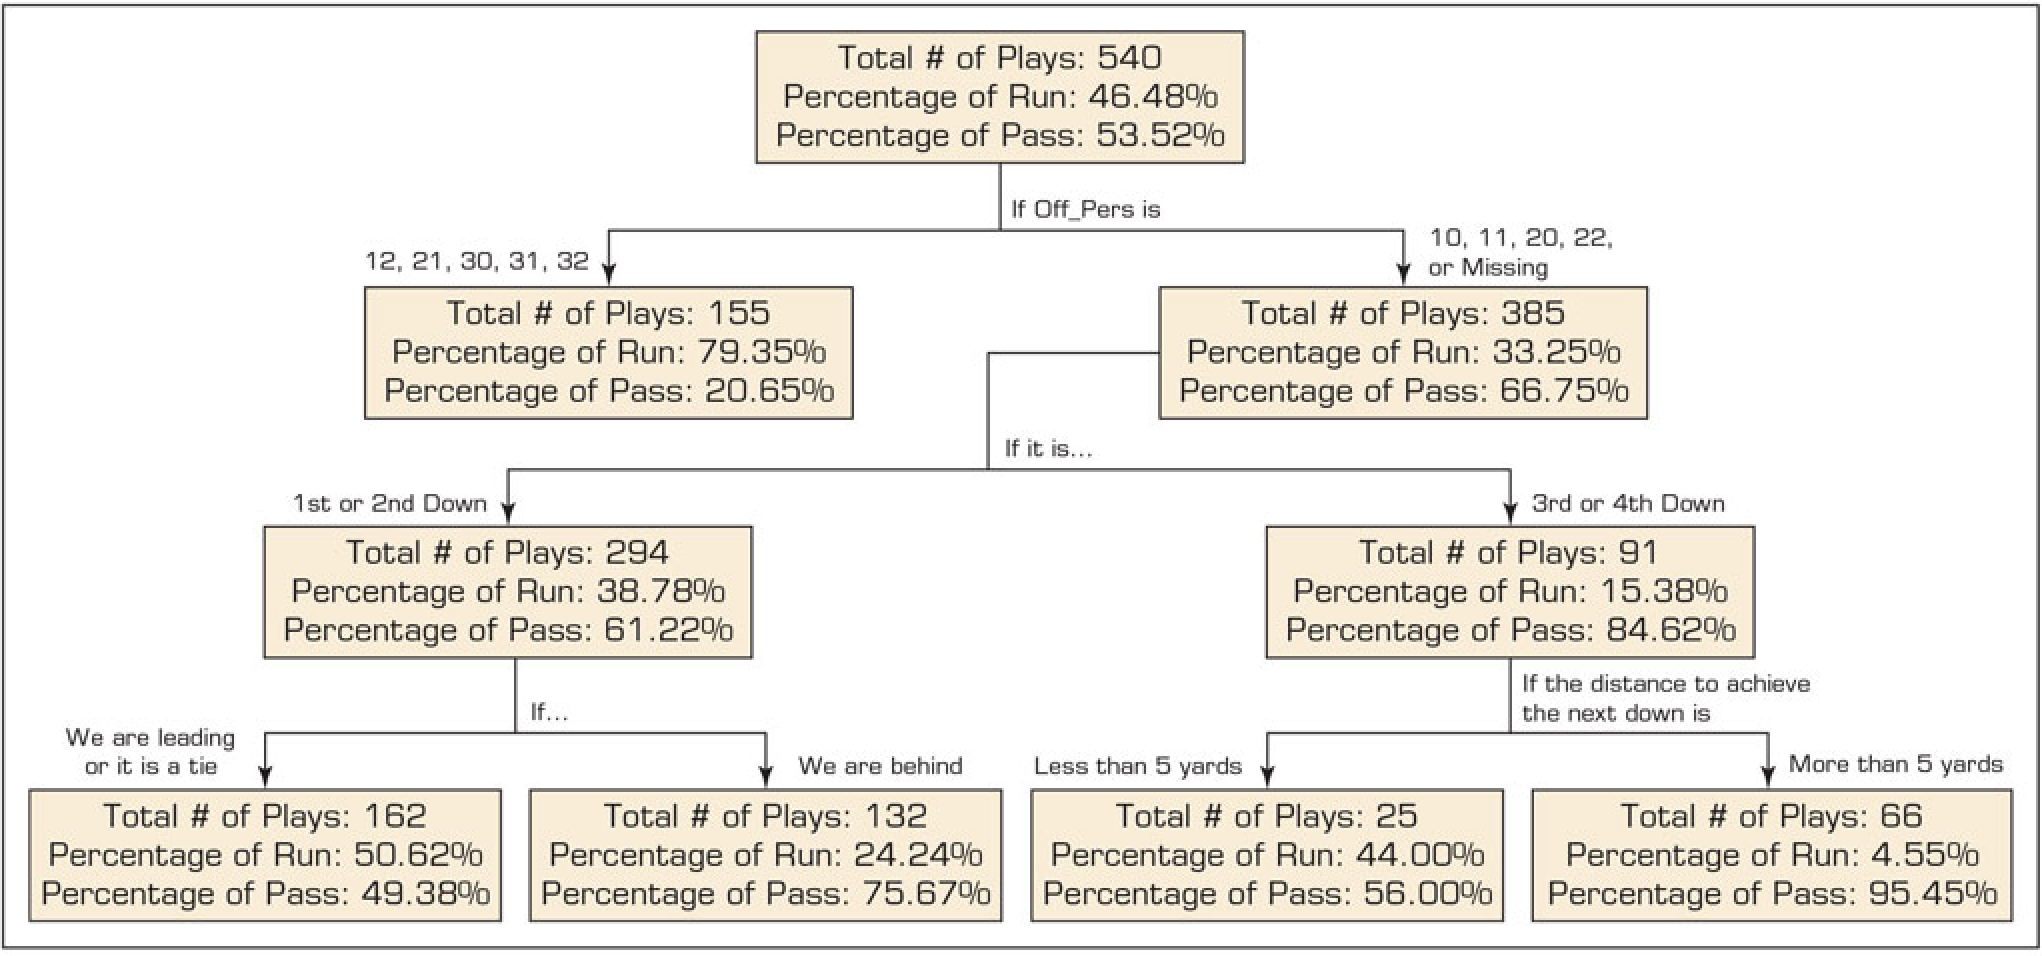
Predicting Run or Pass in the Next Play
- A decision tree is a machine learning model that makes decisions by splitting data into branches based on input variables.
- Off_Pers: Offensive Personnel (e.g., Value “11” meaning 1 running back, 1 tight end, and 3 wide receivers)
2. Team Tactics
Decision Tree for Run or Pass Plays in Football
Predicting Run or Pass in the Next Play
- If a football team sees an opponent team’s personnel formation that looks like a pass, and it is third or fourth down with more than 5 yards to go, how likely would the opponent team pass in the next play?
3. Player Performance: The Case of Hockey

Peter Forsberg

Sidney Crosby
- How is the presence of a legend player (e.g., Peter Forsberg or Sidney Crosby) associated with the likelihood of making a goal?
What is BI?
Business Intelligence (BI) is a process that involves the collection, integration, analysis, and presentation of business data to support better decision-making.
How Does It Work?
- Data Collection: Gathering data from various sources, like databases.
- Data Integration: Combining data into a unified view.
- Data Analysis: Identifying trends and insights from data.
- Reporting and Visualization: Displaying data via dashboards, reports, and visualizations.
Popular BI tools
![]()
![]()
![]()
- Python and R can also be BI tools.