Lecture 3
Introduction with Sports Analytics
August 30, 2024
Sports Analytics—Understanding Applications of Data Anlytics
Sports Analytics
Moneyball’s Impact


- The use of data analytics for sports was popularized by the Moneyball book by Michael Lewis in 2003 and the movie starring Brad Pitt and Jonah Hill in 2011.
What is Sports Analytics?
Sports analytics is the use of data analysis and statistical techniques, such as, machine learning, to evaluate and improve the performance of athletes, teams, and organizations in sports.
It involves collecting and analyzing data related to various aspects of sports:
- Player Performance Analysis
- Team Tactics Analysis
- Injury Prevention and Recovery
- Recruitment and Scouting
- Fan Engagement and Business Operations
What is Machine Learning?

Machine Learning (ML) algorithm allows computers to learn from data and improve their performance on tasks without being explicitly programmed.
How Does It Work?
- Computers are given large amounts of data.
- They use statistical algorithms (step-by-step instructions with statistics) to find patterns in that data.
- Based on these patterns, the computer makes predictions or decisions.
1. Fan Analytics

Season Ticket Renewals—Likelihood to Purchase Again
e.g., 69% of fans in Tier 1 seats who said on the survey that they would “probably not” renew actually did.
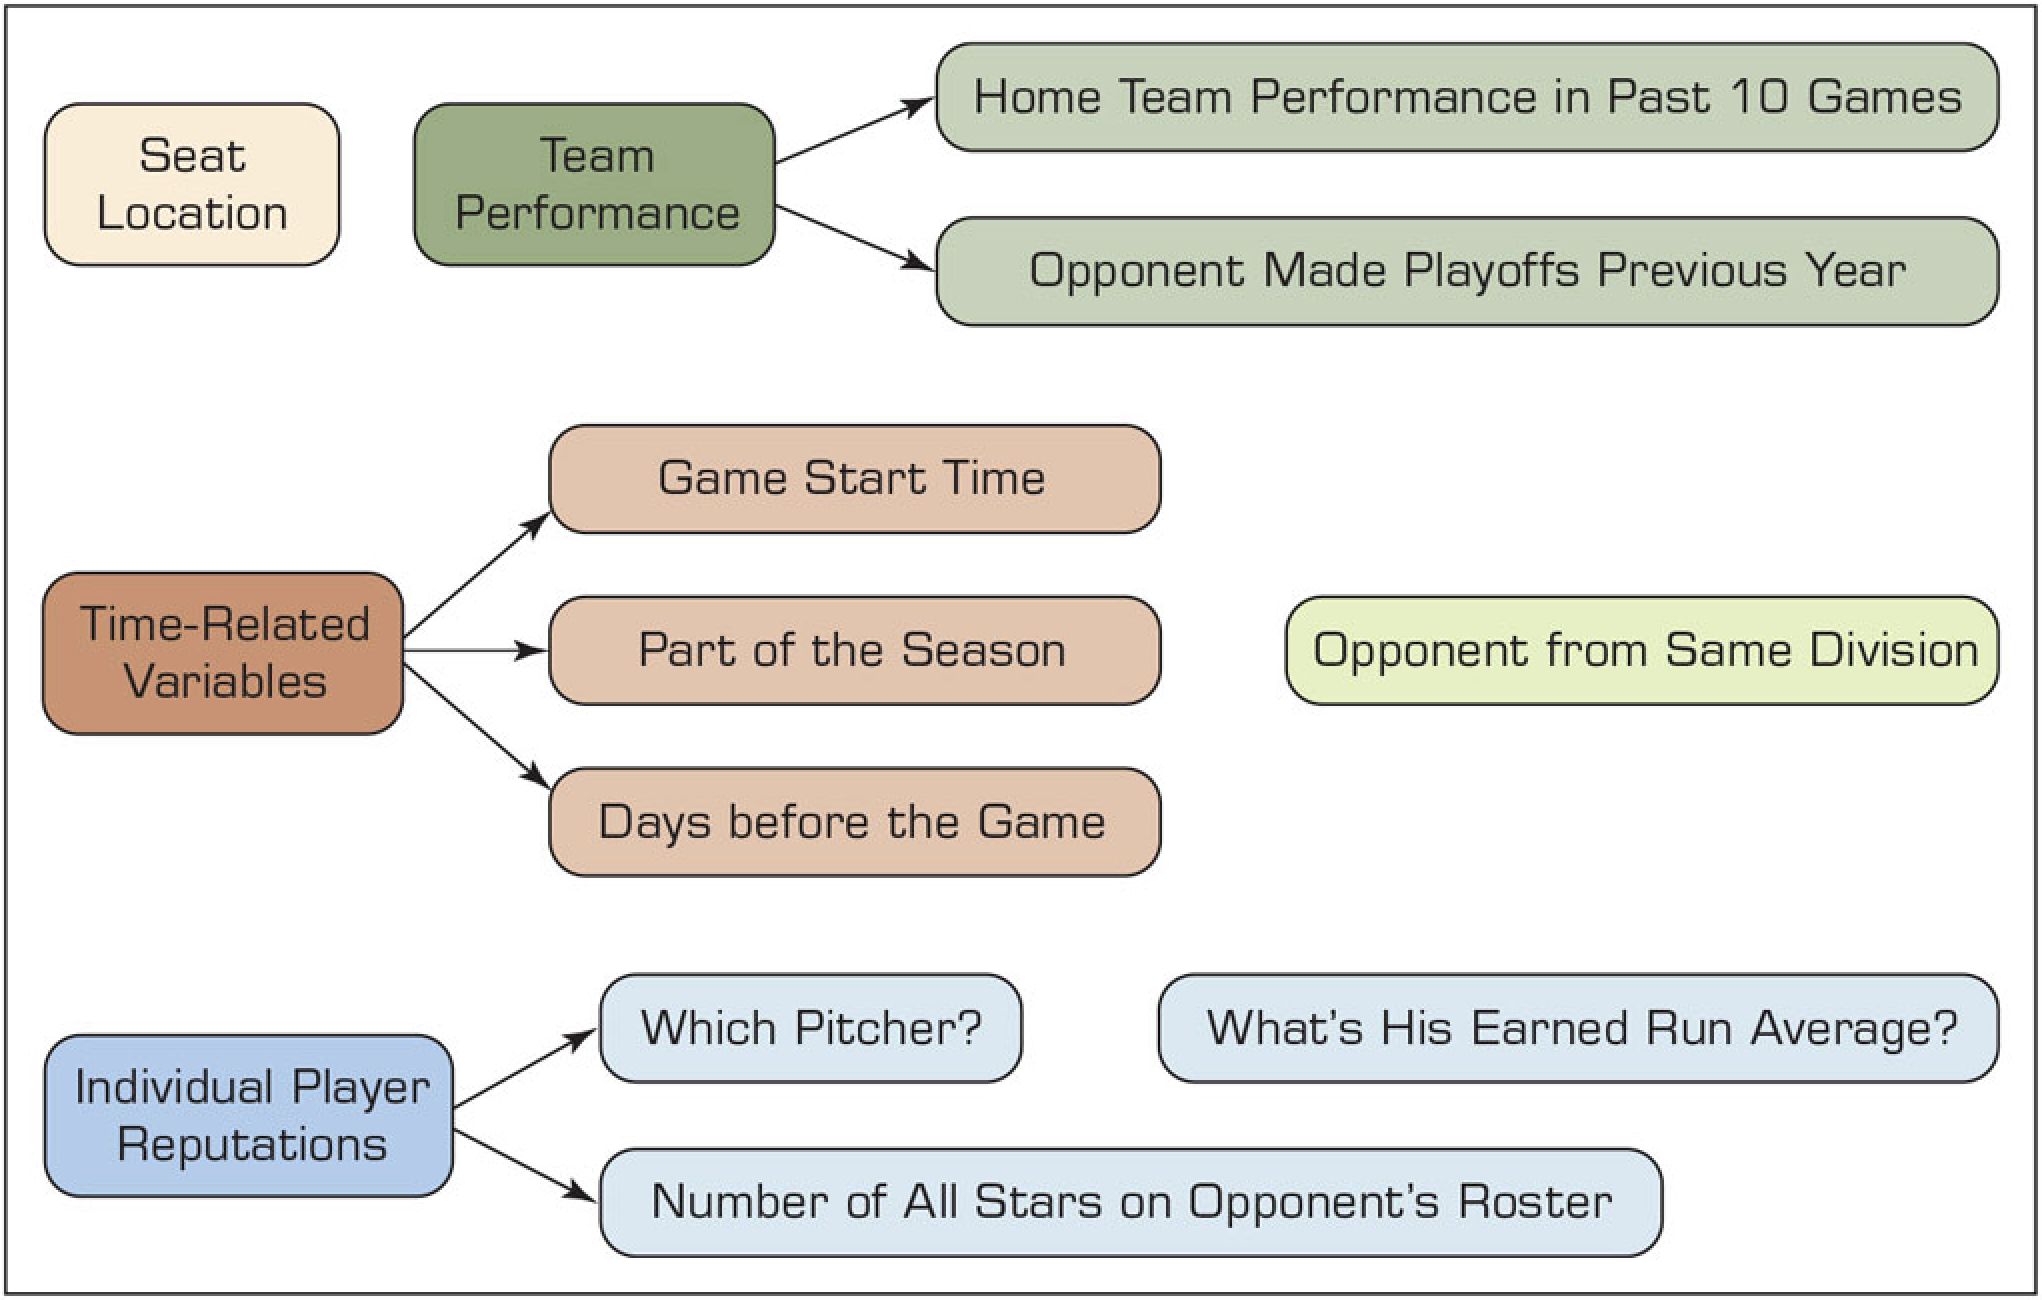
The types of questions for fan analytics would be:
- Why do season ticket holders renew their tickets?
- What factors drive last-minute individual seat ticket purchases?
- How to price the tickets?
1. Fan Analytics

- Business offices at sports team do dynamic pricing:
- It adjusts ticket prices based on various factors such as the team’s performance, opponent, game time, and real-time data like weather and traffic.
2. Team Tactics
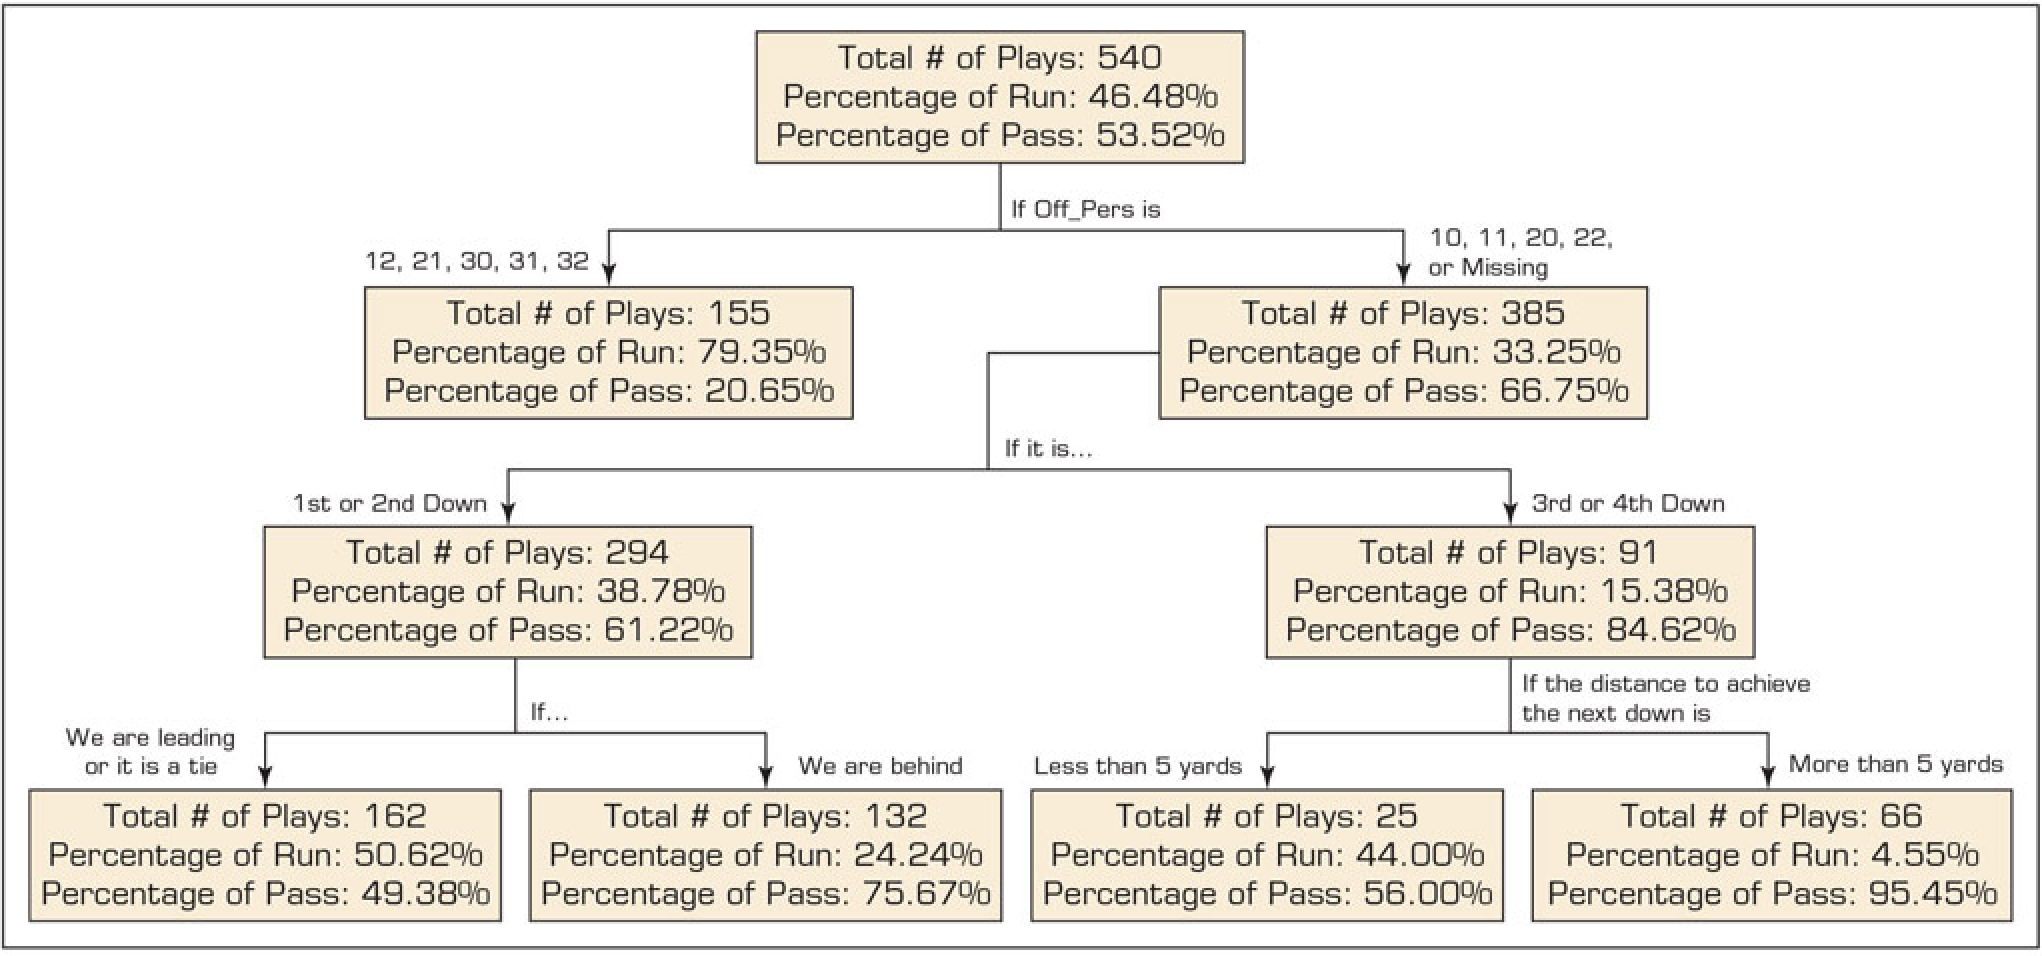
Decision Tree for Run or Pass Plays in Football

Run or Pass in the Next Play
- A decision tree is a machine learning model that makes decisions by splitting data into branches based on input variables.
- Off_Pers: Offensive Personnel (e.g., Value “11” meaning 1 running back, 1 tight end, and 3 wide receivers)
2. Team Tactics
Decision Tree for Run or Pass Plays in Football

Run or Pass in the Next Play
- If a football team sees an opponent team’s personnel formation that looks like a pass, and it is third or fourth down with more than 5 yards to go, how likely would the opponent team pass in the next play?
3. Hockey Player Performance
\[ PM \,=\, (\text{Number of his team's goal}) \,-\, (\text{Number of opponent team's goal}) \]
The player “plus-minus” (PM) is a common hockey performance metric.
The limits of this approach are obvious:
- There is no accounting for teammates or opponents.
- In hockey, where players tend to be grouped together on “lines” and coaches will “line match” against opponents, a player’s PM can be artificially inflated or deflated by the play of his opponents and peers.
Here, we instead use machine learning methods to analyze how likely making a goal is associated with whether or not a player is on the ice.
3. Hockey Player Performance
Data
The data comprise of play-by-play NHL game data for regular and playoff games during 11 seasons of 2002-2003 through 2013-2014.
There were 2,439 players involved in 69,449 goals.
The data contains information that indicates:
- Seasons
- Home & away teams
- Team configuration such as 5 on 4 powerplay
- Which players are on & off the ice when a goal is made.
3. Hockey Player Performance

Peter Forsberg

Sidney Crosby
- How is the presence of a legend player, e.g., Peter Forsberg or Sidney Crosby, associated with the likelihood of making a goal?