Lecture 1
Syllabus and Course Outline
August 24, 2026
Instructor
Instructor
Current Appointment & Education
Name: Byeong-Hak Choe.
Assistant Professor of Data Analytics and Economics, School of Business at SUNY Geneseo.
Ph.D. in Economics from University of Wyoming.
M.S. in Economics from Arizona State University.
M.A. in Economics from SUNY Stony Brook.
B.A. in Economics & B.S. in Applied Mathematics from Hanyang University at Ansan, South Korea.
- Minor in Business Administration.
- Concentration in Finance.
Instructor
Economics and Data Science
Choe, B.H., 2021. “Social Media Campaigns, Lobbying and Legislation: Evidence from #climatechange and Energy Lobbies.”
Question: To what extent do social media campaigns compete with fossil fuel lobbying on climate change legislation?
Data include:
- 5.0 million tweets with #climatechange/#globalwarming around the globe;
- 12.0 million retweets/likes to those tweets;
- 0.8 million Twitter users who wrote those tweets;
- 1.4 million Twitter users who retweeted or liked those tweets;
- 0.3 million US Twitter users with their location at a city level;
- Firm-level lobbying data (expenses, targeted bills, etc.).
Instructor
Economics and Data Science
Choe, B.H. and Ore-Monago, T., 2024. “Governance and Climate Finance in the Developing World”
Climate finance refers to the financial resources allocated for mitigating and adapting to climate change, including support for initiatives that reduce greenhouse gas emissions and enhance resilience to climate impacts.
- We focus on transnational financing that rich countries provide poor countries with financial resources, in order to help them adapt to climate change and mitigate greenhouse gas (GHG) emissions.
- Since the GHG emissions in developing countries are rapidly growing, it is crucial to assess the effectiveness of climate finance.
- Poor governance (e.g., legal system, rule of law, and accountability) can be significant barriers to emissions reductions.
Instructor
Economics and Data Science
- Choe, B.H. and Newbold, Steve, “Speed vs. Safety”
The policy tradeoff
- Higher travel speeds create time-saving benefits.
- They can also increase fatal-crash risk.
- The policy question is whether the time savings justify the safety costs.
How VSL enters the analysis
\[ \begin{aligned} \text{Net benefits} &= \text{time-saving benefits} - \text{safety costs},\\ \text{safety costs} &= \Delta\text{ expected fatalities} \times \text{VSL}. \end{aligned} \]
- An established Value of a Statistical Life (VSL) converts changes in mortality risk into monetary terms for benefit–cost analysis.
- We apply VSL as an input; we do not estimate VSL.
Instructor
Economics and Data Science
- Choe, B.H., “Scaling Platform Monitoring: Assignment, Participation, and Competition in Online Chess”
- Setting: Chess.com’s weekly Titled Tuesday tournament gradually shifted from selective Zoom monitoring toward scalable Proctor software.
- Question: How do tournament performance and participation change as real-time monitoring expands?
- Data: 469,953 games from 208 Early and Late sessions (2023–2025), linked to standings, pairings, pregame ratings, and session-level assignment counts.

Syllabus
Syllabus
Email, Class & Office Hours
Email: bchoe@geneseo.edu
Class Homepage:
Office: South Hall 227B
Office Hours:
- Mondays and Wednesdays, 1:45 P.M.–3:15 P.M. (walk-in).
- By appointment via email if the walk-in hours do not work.
Syllabus
Course Description
- This course provides an applied overview of the data analytic process and methods.
- The goal of this course is to help students unlock the potential of data analysis and improve the ability to transform data into a powerful tool in decision making.
- Students will develop foundational data analytics skills to prepare for a career or future learning that involves more advanced topics in data analytics.
Syllabus
Course Description
- Topics covered include
- Introduction to Data Analytics thinking
- Data tools and skills
- Data management and preparation techniques
- Data storytelling for effective visualization and communication.
- During the course, students will work hands-on with the R programming and its associated data analysis packages.
Syllabus
Course Learning Outcomes
- Grasp the basic principles of data analytics, including data types and data processing.
- Gain introductory experience with programming languages commonly used in data analytics, such as R.
- Develop the ability to create and interpret various types of data visualizations.
- Enhance critical thinking skills by learning to ask relevant questions and draw insights from data.
- Apply data analytics techniques to solve real-world problems in various domains.
Syllabus
Reference Materials - Concepts
- Cloud Computing Concepts Hub — Amazon Web Services (AWS)
- Storytelling with Data: A Data Visualization Guide for Business Professionals — Cole Nussbaumer Knaflic. (ISBN-13: 978-1119002253; ISBN-10: 1119002257)
- Storytelling with Data: Before and After - Practical Makeovers for Powerful Data Stories — Cole Nussbaumer Knaflic, Mike Cisneros, and Alex Velez. (ISBN-13: 978-1394289615; ISBN-10: 1394289618)
Syllabus
Reference Materials - Coding
- Hands-On Programming with R — Garrett Grolemund. (ISBN-13: 978-1449359010; ISBN-10: 1449359019)
- Free online version is available here
- R for Data Science (2nd Edition) — Hadley Wickham & Garrett Grolemund. (ISBN-13: 978-1492097402; ISBN-10: 1492097403)
- Free online version is available here.
- Statistical Inference via Data Science: A ModernDive into R and the Tidyverse — Chester Ismay & Albert Y. Kim. (ISBN-13: 978-0367409821; ISBN-10: 0367409828)
- Free online version is available here.
Syllabus
Course Requirements
- Homework: Five assignments.
- Quiz: Two in-class quizzes.
- Participation: In-person and online participation
- Exams: One midterm exam and one comprehensive final exam.
- Group Project: a data storytelling project with a group presentation.
- Required Textbook: Ethan Mollick, Co-Intelligence: Living and Working with AI.
Syllabus
Data Storytelling Group Project
Each group will present on data storytelling with visualization.
Data storytelling with visualization is the practice of communicating complex insights in a clear, engaging, and impactful way by combining data analysis, visual design, and narrative techniques.
It is more than just presenting charts and graphs; it involves shaping a compelling story that guides the audience through the data, emphasizes key findings, and delivers the intended message effectively.
Syllabus
Course Contents
Syllabus
Course Contents
Syllabus
Course Contents
Syllabus
Grading
\[ \begin{align} (\text{Total Percentage Grade}) =&\quad\;\; 0.05\times(\text{Attendance}) \notag\\ &\,+\, 0.05\times(\text{Quiz & Participation})\notag\\ & \,+\, 0.20\times(\text{Homework})\notag\\ &\,+\, 0.20\times(\text{Presentation})\notag\\ & \,+\, 0.50\times(\text{Exam}).\notag \end{align} \]
Syllabus
Grading - Attendance & Homework
You are allowed up to 4 absences in the MW course and 6 absences in the MWF course without penalty.
- Send me an email if you have standard excused reasons (illness, family emergency, transportation problems, etc.).
For each absence beyond the initial four/six, there will be a deduction of 1% point from the Total Percentage Grade.
The single lowest homework score will be dropped when calculating the total homework score.
- Each homework except for the homework with the lowest score accounts for 25% of the total homework score.
Syllabus
Grading - Exams
- The course has one midterm exam and one comprehensive final exam.
- The midterm is scheduled for Monday, October 19.
- Exams account for 50% of the Total Percentage Grade.
Syllabus
Grading - Total Exam Score
\[ \begin{align} \text{Total Exam Score} =\, &0.30\times(\text{Midterm Exam Score})\notag\\ &\quad +\,0.70\times(\text{Final Exam Score}).\notag \end{align} \]
- The Midterm Exam accounts for 30% and the Final Exam accounts for 70% of the Total Exam Score.
Syllabus
Make-up Policy
Make-up exams will not be given unless you have either a medically verified excuse or an absence excused by the University.
If you cannot take exams because of religious obligations, notify me by email at least two weeks in advance so that an alternative exam time may be set.
A missed exam without an excused absence earns a grade of zero.
Late submissions for homework assignment will be accepted with a penalty.
A zero will be recorded for a missed assignment.
Syllabus
Academic Integrity and Plagiarism
All homework assignments and exams must be the original work by you.
Examples of academic dishonesty include:
- Representing the work, thoughts, and ideas of another person as your own
- Allowing others to represent your work, thoughts, or ideas as theirs, and
- Being complicit in academic dishonesty by suspecting or knowing of it and not taking action.
Geneseo’s Library offers frequent workshops to help you understand how to paraphrase, quote, and cite outside sources properly.
Syllabus
Artificial Intelligence (AI) Policy
Unless AI tools are explicitly permitted for homework, you must complete your work independently.
This means you should not use tools like ChatGPT for any aspect of our coursework.
Such use is a form of academic dishonesty. Use of such tools is not only cheating, it will also cheat you of the opportunity to learn and develop your own skills.
While AI will undoubtedly play important roles in our future society, you will be better able to utilize AI if you have developed your own critical thinking, writing, and analytical skills by doing your own work.
If you have any questions about this, please ask.
Syllabus
Accessibility
The Office of Accessibility will coordinate reasonable accommodations for persons with physical, emotional, or cognitive disabilities to ensure equal access to academic programs, activities, and services at Geneseo.
Please contact me and the Office of Accessibility Services for questions related to access and accommodations.
Syllabus
Career Design
To get information about career development, you can visit the Career Development Events Calendar (https://www.geneseo.edu/career_development/events/calendar).
You can stop by South 112 to get assistance in completing your Handshake Profile https://app.joinhandshake.com/login.
- Handshake is ranked #1 by students as the best place to find full-time jobs.
- 50% of the 2018-2020 graduates received a job or internship offer on Handshake.
- Handshake is trusted by all 500 of the Fortune 500.
🎬 Prologue
💡 Why Data Analytics?
Data analytics connects questions to evidence-based decisions.
It fills the gap between learning a concept and applying it to real data:
- locate and collect data;
- clean, reshape, and explore it; and
- visualize and communicate what the evidence means.
These skills complement business and economics knowledge: domain knowledge tells us what to ask and whether an answer makes sense.
🔄 From Data to Decisions
Ask → Collect → Clean → Explore → Visualize → Communicate → Decide
The workflow is iterative: an unexpected pattern may send us back to the question, the data source, or the cleaning step.
Generative AI can assist at several stages, but the analyst remains responsible for context, verification, and judgment.
🎓 You, at the end of this course

Prepare data
Clean and reshape real-world datasets.
Create evidence
Build clear summaries and visualizations.
Tell the story
Explain findings, limits, and implications.
💼 Where Data Analytics Skills Are Used
Data skills support many roles: data analyst, business analyst, market analyst, financial analyst, human resource analyst, economist, and more.
The U.S. Bureau of Labor Statistics projects employment of data scientists to grow 34% from 2024 to 2034, compared with 3% for all occupations.
- BLS projects about 23,400 openings per year on average over the decade.
Job titles differ, but the shared skill is turning messy data into evidence that someone can use.
🧰 Why R, Python, and Databases?
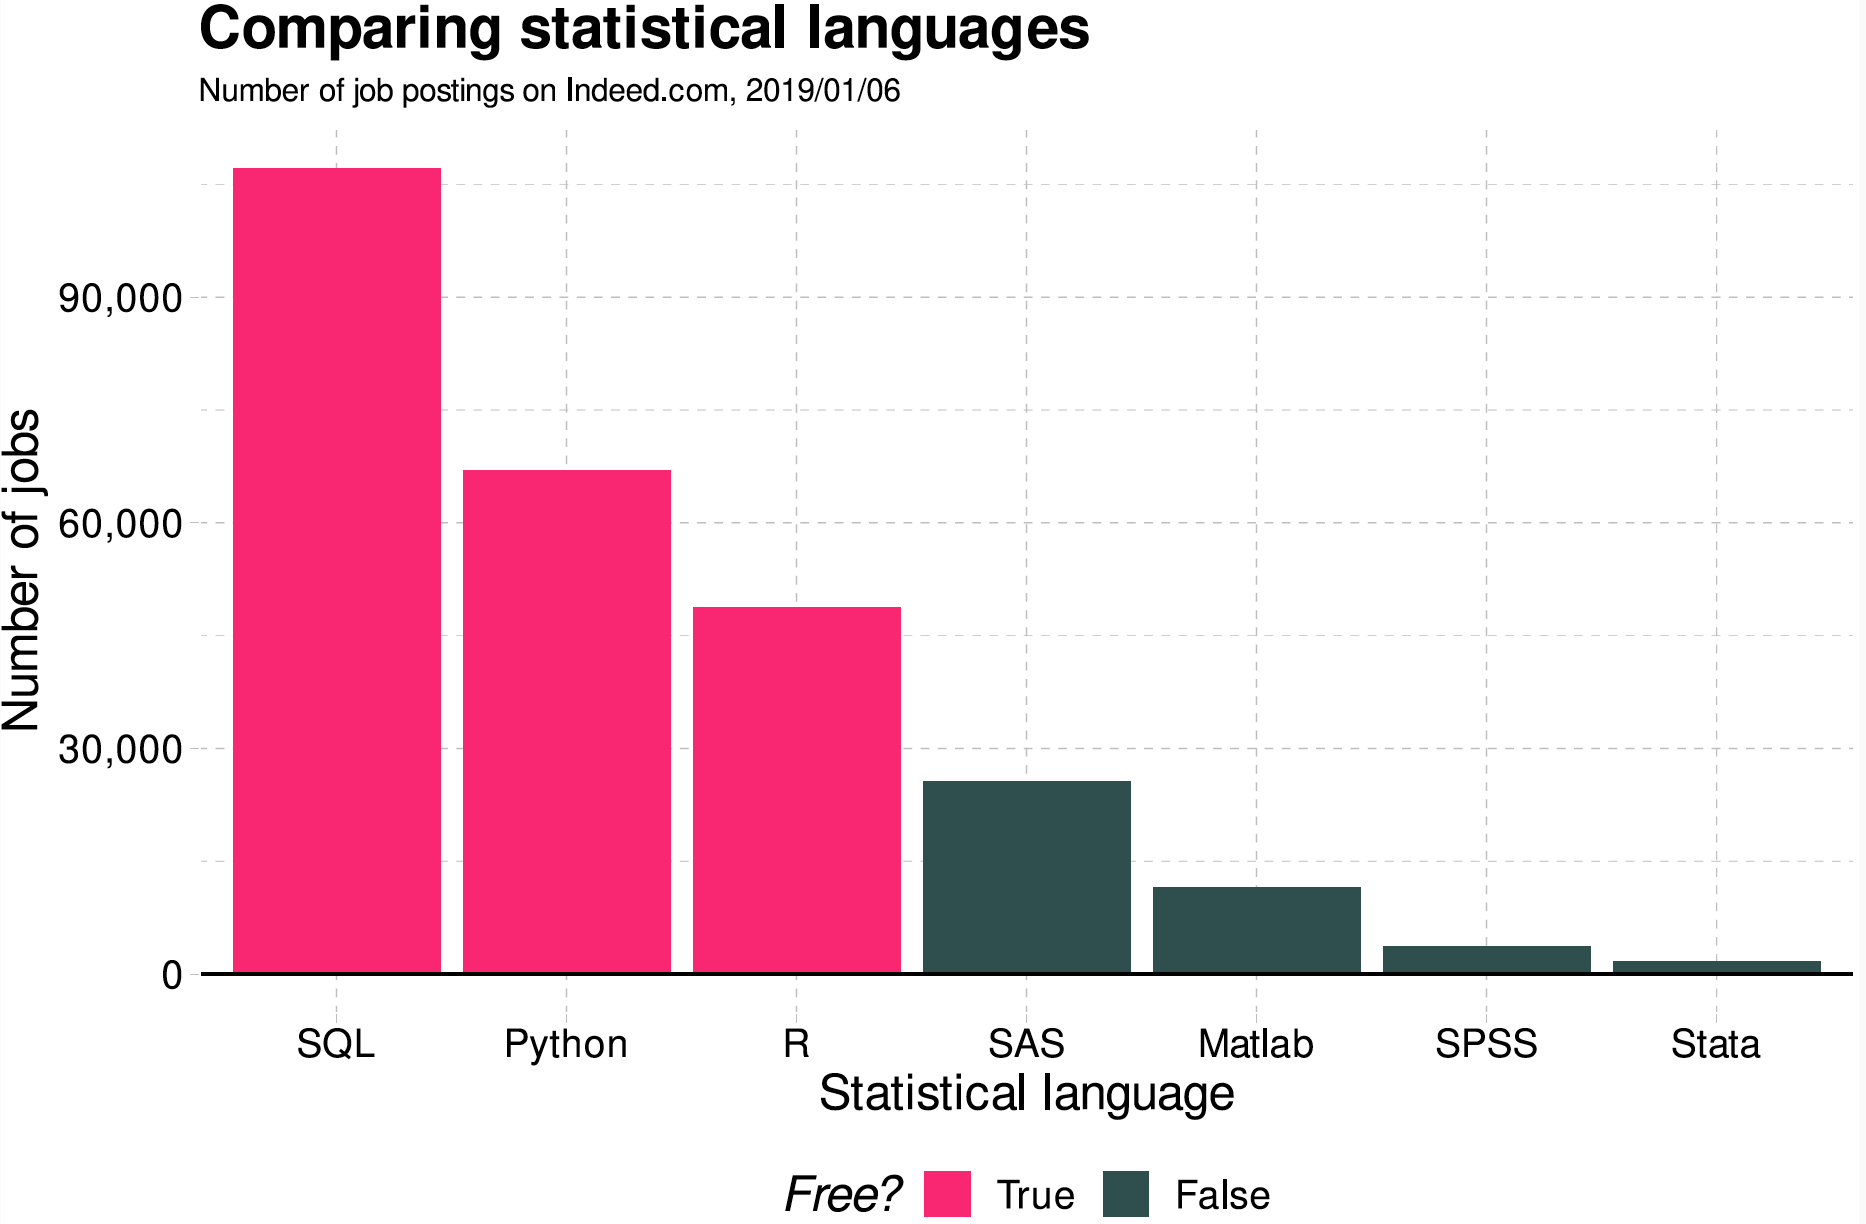
- Historical snapshot (2019): SQL led, followed by Python and R.