Lecture 1
Syllabus and Course Outline
August 25, 2025
Instructor
Instructor
Current Appointment & Education
Name: Byeong-Hak Choe.
Assistant Professor of Data Analytics and Economics, School of Business at SUNY Geneseo.
Ph.D. in Economics from University of Wyoming.
M.S. in Economics from Arizona State University.
M.A. in Economics from SUNY Stony Brook.
B.A. in Economics & B.S. in Applied Mathematics from Hanyang University at Ansan, South Korea.
- Minor in Business Administration.
- Concentration in Finance.
Instructor
Economics and Data Science
Choe, B.H., 2021. “Social Media Campaigns, Lobbying and Legislation: Evidence from #climatechange and Energy Lobbies.”
Question: To what extent do social media campaigns compete with fossil fuel lobbying on climate change legislation?
Data include:
- 5.0 million tweets with #climatechange/#globalwarming around the globe;
- 12.0 million retweets/likes to those tweets;
- 0.8 million Twitter users who wrote those tweets;
- 1.4 million Twitter users who retweeted or liked those tweets;
- 0.3 million US Twitter users with their location at a city level;
- Firm-level lobbying data (expenses, targeted bills, etc.).
Instructor
Economics and Data Science
Choe, B.H. and Ore-Monago, T., 2024. “Governance and Climate Finance in the Developing World”
Climate finance refers to the financial resources allocated for mitigating and adapting to climate change, including support for initiatives that reduce greenhouse gas emissions and enhance resilience to climate impacts.
- We focus on transnational financing that rich countries provide poor countries with financial resources, in order to help them adapt to climate change and mitigate greenhouse gas (GHG) emissions.
- Since the GHG emissions in developing countries are rapidly growing, it is crucial to assess the effectiveness of climate finance.
- Poor governance (e.g., legal system, rule of law, and accountability) can be significant barriers to emissions reductions.
Instructor
Economics and Data Science
Choe, B.H. and Newbold, Steve, “Estimating the Value of Statistical Life (VSL) through Big Data”
VSL is the monetary value associated with reducing the risk of death.
- How much value would that be? How can we measure it?
- How do government agencies use the VSL to decide which policies are worth the cost when they reduce the risk of death?
Syllabus
Syllabus
Email, Class & Office Hours
Email: bchoe@geneseo.edu
Class Homepage:
Office: South Hall 227B
Office Hours:
- Mondays and Wednesdays 3:30 P.M.–5:00 P.M.
- By appointment via email.
Syllabus
Course Description
- This course provides an applied overview of the data analytic process and methods.
- The goal of this course is to help students unlock the potential of data analysis and improve the ability to transform data into a powerful tool in decision making.
- Students will develop foundational data analytics skills to prepare for a career or future learning that involves more advanced topics in data analytics.
Syllabus
Course Description
- Topics covered include
- Introduction to Data Analytics thinking
- Data tools and skills
- Data management and preparation techniques
- Data storytelling for effective visualization and communication.
- During the course, students will work hands-on with the R programming and its associated data analysis packages.
Syllabus
Course Learning Outcomes
- Grasp the basic principles of data analytics, including data types and data processing.
- Gain introductory experience with programming languages commonly used in data analytics, such as R.
- Develop the ability to create and interpret various types of data visualizations.
- Enhance critical thinking skills by learning to ask relevant questions and draw insights from data.
- Apply data analytics techniques to solve real-world problems in various domains.
Syllabus
Reference Materials - Concepts
- Cloud Computing Concepts Hub — Amazon Web Services (AWS)
- Co-Intelligence: Living and Working with AI — Ethan Mollick. (ISBN-13: 978-0593716717; ISBN-10: 059371671X)
- Storytelling with Data: A Data Visualization Guide for Business Professionals — Cole Nussbaumer Knaflic. (ISBN-13: 978-1119002253; ISBN-10: 1119002257)
- Storytelling with Data: Before and After - Practical Makeovers for Powerful Data Stories — Cole Nussbaumer Knaflic, Mike Cisneros, and Alex Velez. (ISBN-13: 978-1394289615; ISBN-10: 1394289618)
Syllabus
Reference Materials - Coding
- Hands-On Programming with R — Garrett Grolemund. (ISBN-13: 978-1449359010; ISBN-10: 1449359019)
- Free online version is available here
- R for Data Science (2nd Edition) — Hadley Wickham & Garrett Grolemund. (ISBN-13: 978-1492097402; ISBN-10: 1492097403)
- Free online version is available here.
- Statistical Inference via Data Science: A ModernDive into R and the Tidyverse — Chester Ismay & Albert Y. Kim. (ISBN-13: 978-0367409821; ISBN-10: 0367409828)
- Free online version is available here.
:::
::::
Syllabus
Course Requirements
- Homework: Five assignments.
- Quiz: Two in-class quizzes.
- Participation: In-person and online participation
- Exam: Two short midterm exams and one comprehensive final exam.
- Project: a data storytelling project with a team presentation.
Syllabus
Data Storytelling Project
Each team will present on data storytelling with visualization.
Data storytelling with visualization is the practice of communicating complex insights in a clear, engaging, and impactful way by combining data analysis, visual design, and narrative techniques.
It is more than just presenting charts and graphs; it involves shaping a compelling story that guides the audience through the data, emphasizes key findings, and delivers the intended message effectively.
Syllabus
Course Contents
Syllabus
Course Contents
Syllabus
Course Contents
Syllabus
Grading
\[ \begin{align} (\text{Total Percentage Grade}) =&\quad\;\; 0.05\times(\text{Attendance}) \notag\\ &\,+\, 0.05\times(\text{Quiz & Participation})\notag\\ & \,+\, 0.20\times(\text{Homework})\notag\\ &\,+\, 0.20\times(\text{Presentation})\notag\\ & \,+\, 0.50\times(\text{Exam}).\notag \end{align} \]
Syllabus
Grading - Attendance & Homework
You are allowed up to 4 absences in the MW course and 6 absences in the MWF course without penalty.
- Send me an email if you have standard excused reasons (illness, family emergency, transportation problems, etc.).
For each absence beyond the initial four/six, there will be a deduction of 1% point from the Total Percentage Grade.
The single lowest homework score will be dropped when calculating the total homework score.
- Each homework except for the homework with the lowest score accounts for 25% of the total homework score.
Syllabus
Grading - Midterm Exam Score
\[ \begin{align} &(\text{Midterm Exam Score}) \\ =\, &\text{max}\,\left\{0.50\times(\text{Midterm Exam 1 Score}) \,+\, 0.50\times(\text{Midterm Exam 2 Score})\right.,\notag\\ &\qquad\;\,\left.0.33\times(\text{Midterm Exam 1 Score}) \,+\, 0.67\times(\text{Midterm Exam 2 Score})\right\}.\notag \end{align} \]
- The Midterm Exam Score is the maximum between
- The simple average of the Midterm Exam 1 Score and the Midterm Exam 2 Score and
- The weighted average of them with one-third weight on the Midterm Exam 1 Score and two-third weight on the Midterm Exam 2 Score:
Syllabus
Grading - Total Exam Score
\[ \begin{align} &(\text{Total Exam Score}) \\ =\, &\text{max}\,\left\{0.50\times(\text{Midterm Exam Score}) \,+\, 0.50\times(\text{Final Exam Score})\right.,\notag\\ &\qquad\;\,\left.0.25\times(\text{Midterm Exam Score}) \,+\, 0.75\times(\text{Final Exam Score})\right\}.\notag \end{align} \]
- The Total Exam score is the maximum between
- The simple average of the Midterm Exam score and the Final Exam score and
- The weighted average of them with one-fourth weight on the Midterm Exam score and three-fourth weight on the Final Exam score:
Syllabus
Make-up Policy
Make-up exams will not be given unless you have either a medically verified excuse or an absence excused by the University.
If you cannot take exams because of religious obligations, notify me by email at least two weeks in advance so that an alternative exam time may be set.
A missed exam without an excused absence earns a grade of zero.
Late submissions for homework assignment will be accepted with a penalty.
A zero will be recorded for a missed assignment.
Syllabus
Academic Integrity and Plagiarism
All homework assignments and exams must be the original work by you.
Examples of academic dishonesty include:
- Representing the work, thoughts, and ideas of another person as your own
- Allowing others to represent your work, thoughts, or ideas as theirs, and
- Being complicit in academic dishonesty by suspecting or knowing of it and not taking action.
Geneseo’s Library offers frequent workshops to help you understand how to paraphrase, quote, and cite outside sources properly.
Syllabus
Artificial Intelligence (AI) Policy
Unless AI tools are explicitly permitted for homework, you must complete your work independently.
This means you should not use tools like ChatGPT for any aspect of our coursework.
Such use is a form of academic dishonesty. Use of such tools is not only cheating, it will also cheat you of the opportunity to learn and develop your own skills.
While AI will undoubtedly play important roles in our future society, you will be better able to utilize AI if you have developed your own critical thinking, writing, and analytical skills by doing your own work.
If you have any questions about this, please ask.
Syllabus
Accessibility
The Office of Accessibility will coordinate reasonable accommodations for persons with physical, emotional, or cognitive disabilities to ensure equal access to academic programs, activities, and services at Geneseo.
Please contact me and the Office of Accessibility Services for questions related to access and accommodations.
Syllabus
Career Design
To get information about career development, you can visit the Career Development Events Calendar (https://www.geneseo.edu/career_development/events/calendar).
You can stop by South 112 to get assistance in completing your Handshake Profile https://app.joinhandshake.com/login.
- Handshake is ranked #1 by students as the best place to find full-time jobs.
- 50% of the 2018-2020 graduates received a job or internship offer on Handshake.
- Handshake is trusted by all 500 of the Fortune 500.
Prologue
Why Data Analytics?
- Fill in the gaps left by traditional business and economics classes.
- Practical skills that will benefit your future career.
- Neglected skills like how to actually find datasets in the wild and clean them.
- Data analytics skills are largely distinct from (and complementary to) the core quantitative works familiar to business undergrads.
- Data visualization, cleaning and wrangling; databases; machine learning; etc.
- In short, we will cover things that I wish someone had taught me when I was undergraduate.
You, at the end of this course

Why Data Analytics?
- Data analysts use analytical tools and techniques to extract meaningful insights from data.
- Skills in data analytics are also useful for business analysts, market analysts, financial analysts, human resource analysts, or economists.
- Breau of Labor Statistics forecasts that the projected growth rate of the employment in the industry related to data analytics from 2021 to 2031 is 36%.
- The average growth rate for all occupations is 5%.
Why R, Python, and Databases?
Why R, Python, and Databases?
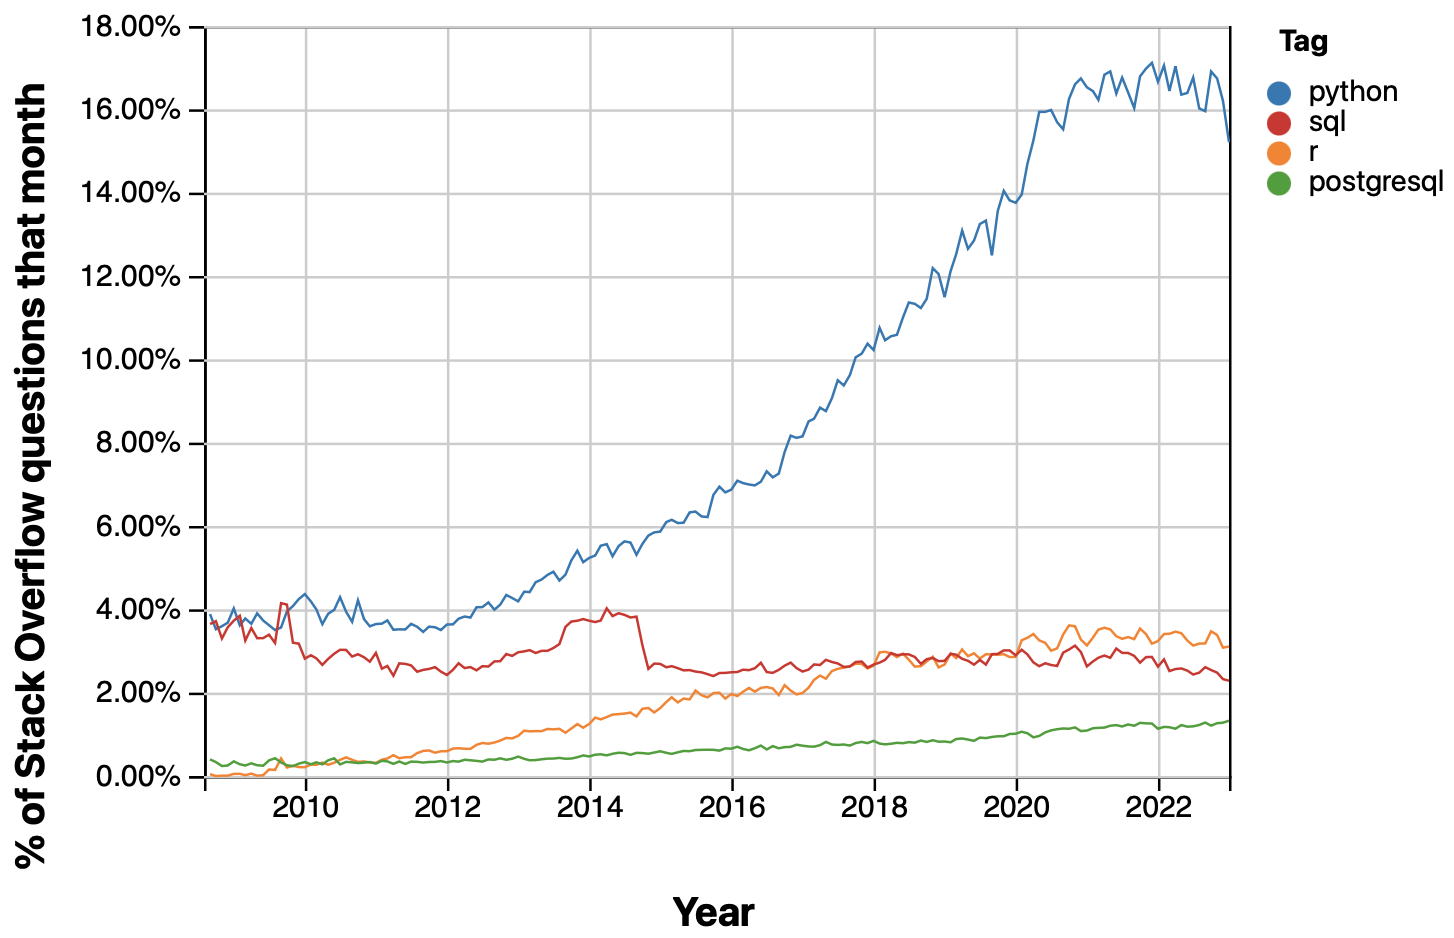
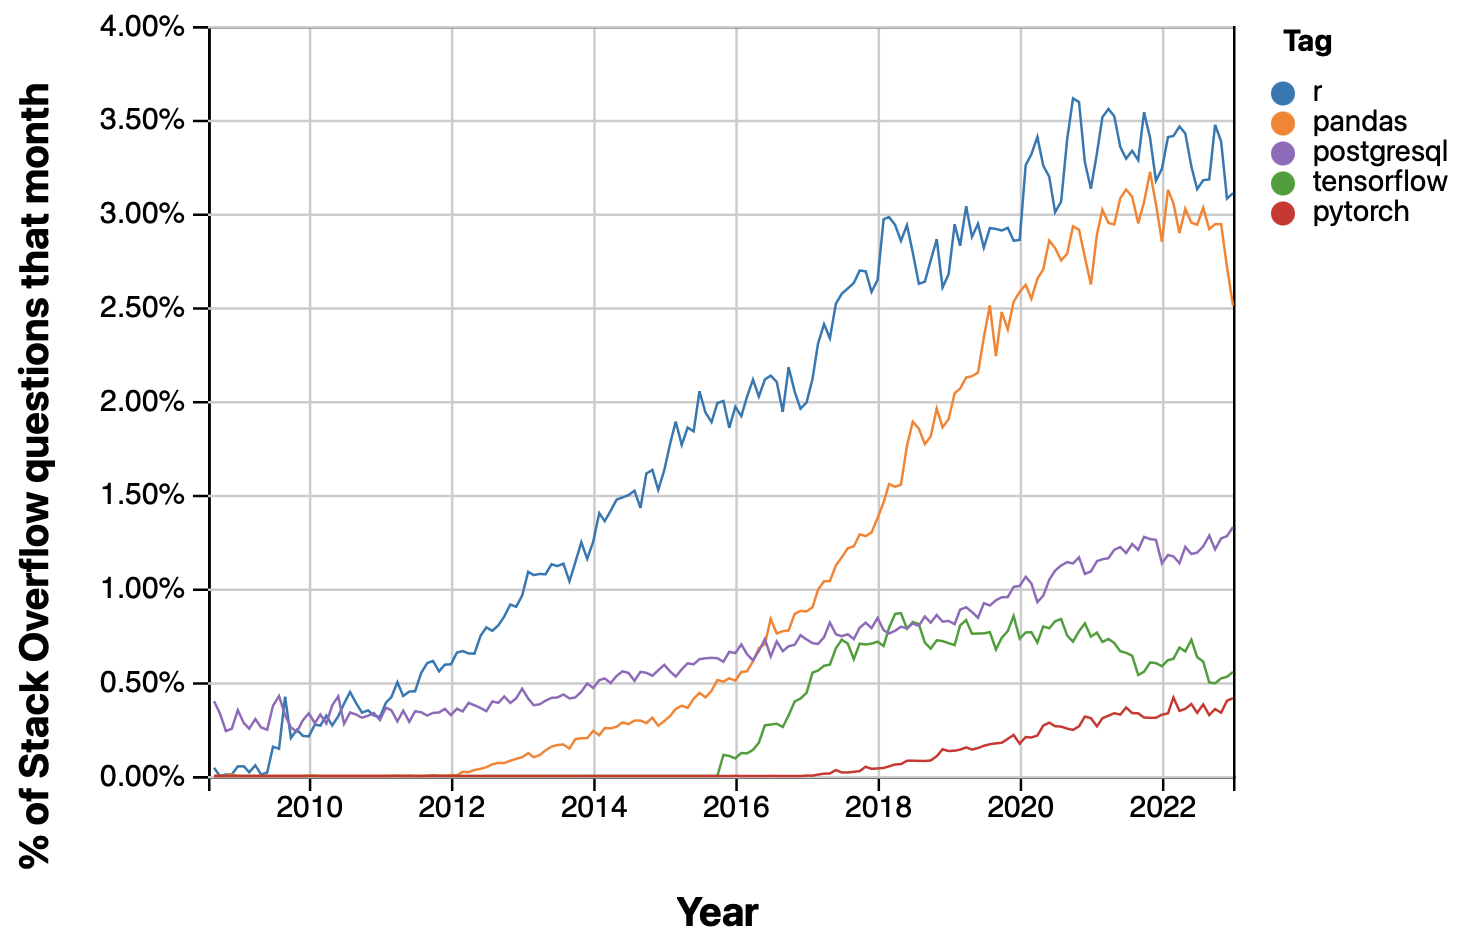
Stack Overflow Trends
Stack Overflow is the most popular Q & A website specifically for programmers and software developers in the world.
See how programming languages have trended over time based on use of their tags in Stack Overflow from 2008 to 2023.
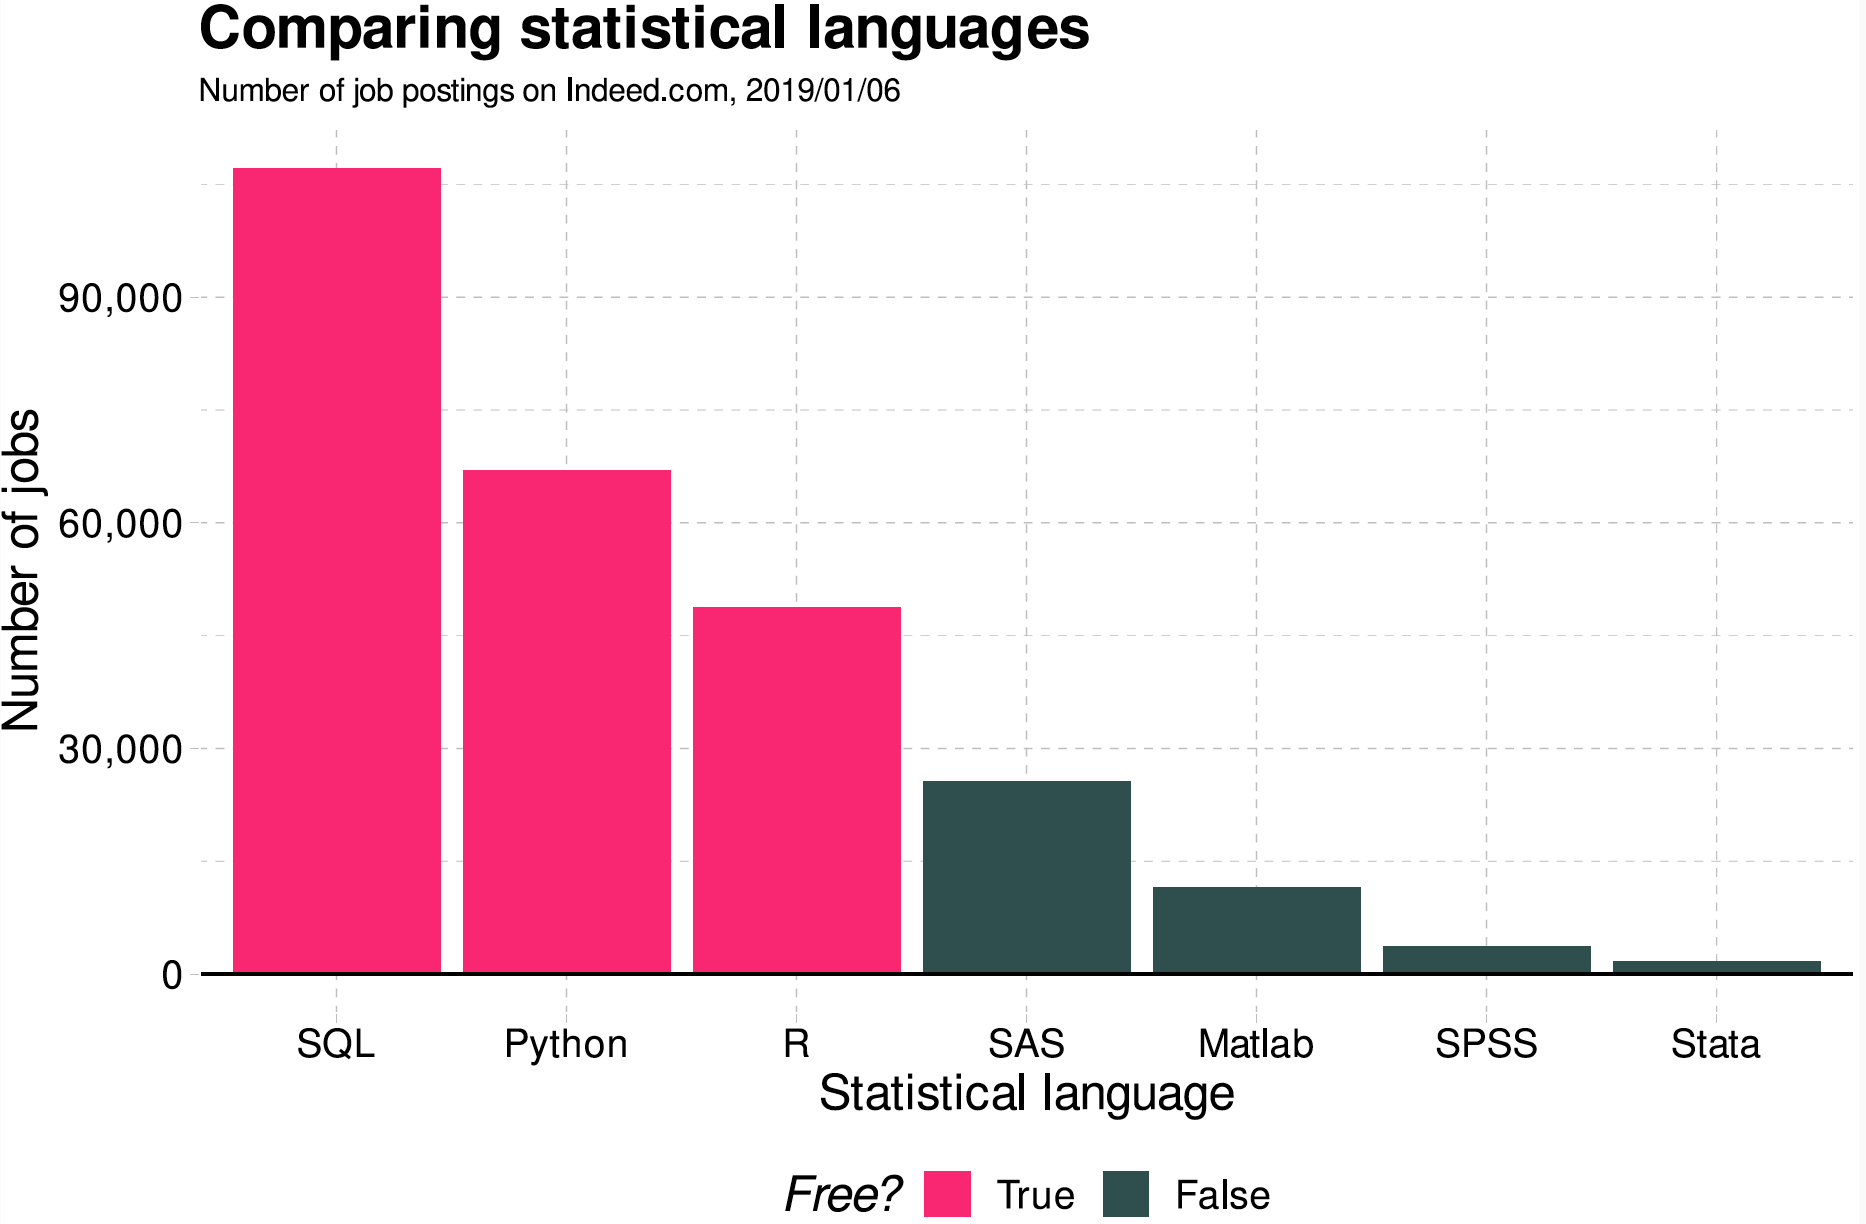
Most Popular Languagues
Data Science and Big Data
Data Analytics and Generative Artificial Intelligence (AI)
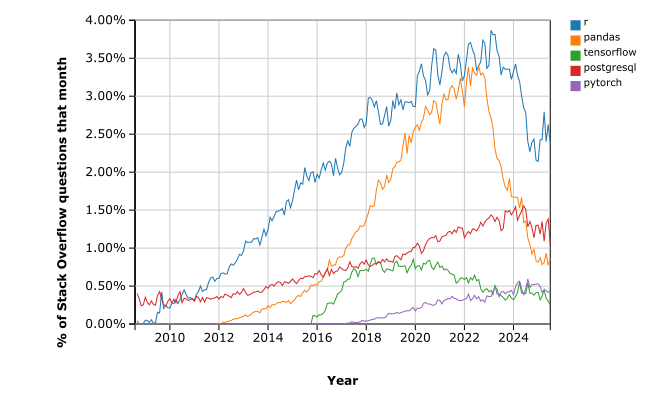
Data Analytics and Big Data Trend
From 2008 to 2025
Programmers in 2025
Data Analytics and Generative AI
- Generative AI refers to a category of AI that is capable of generating new content, ranging from text, images, and videos to music and code.
- In the early 2020s, advances in transformer-based deep neural networks enabled a number of generative AI systems notable for accepting natural language prompts as input.
- These include large language model (LLM) chatbots (e.g., ChatGPT, Claude, Gemini, Copilot, Grok).
- ChatGPT (Chat Generative Pre-trained Transformer) is a chatbot developed by OpenAI and launched on November 30, 2022.
- By January 2023, it had become what was then the fastest-growing consumer software application in history.
Data Analytics and Generative AI
- Users around the world have explored how to best utilize GPT for writing essays and programming codes.
- Is AI a threat to data analytics?
- Fundamental understanding of the subject matter is still crucial for effectively utilizing AI’s capabilities.
- If you use Generative AI such as ChatGPT, please try to understand what ChatGPT gives you.
- Copying and pasting it without any understanding harms your learning opportunity.
DANL Tools
What is R?
R is a programming language and software environment designed for statistical computing and graphics.
R has become a major tool in data analysis, statistical modeling, and visualization.
- It is widely used among statisticians and data scientists for developing statistical software and performing data analysis.
- R is open source and freely available.
What is RStudio?
- RStudio is an integrated development environment (IDE) for R.
- An IDE is a software application that provides comprehensive facilities (e.g., text code editor, graphical user interface (GUI)) to computer programmers for software development.
- RStudio is a user-friendly interface that makes using R easier and more interactive.
- It provides a console, syntax-highlighting editor that supports direct code execution, as well as tools for plotting, history, debugging, and workspace management.
- We will use a free cloud version of RStudio, which is Posit Cloud.
What is Python?
Python is a versatile programming language known for its simplicity and readability.
Python has become a dominant tool in various fields including data analysis, machine learning, and web development.
- It is widely used among developers, data scientists, and researchers for building applications and performing data-driven tasks.
- Python is open source and has a vast ecosystem of libraries and frameworks.
What is Jupyter?
- Jupyter is an open-source integrated development environment (IDE) primarily for Python, though it supports many other languages.
- Jupyter provides a notebook interface that allows users to write and execute code in a more interactive and visual format.
- Jupyter Notebook is a user-friendly environment that enhances coding, data analysis, and visualization.
- It offers a web-based interface that combines live code, equations, visualizations, and narrative text.
- Jupyter is widely used for data science, machine learning, and research, enabling easy sharing and collaboration.
- You can use a free cloud version of Jupyter, which is Google Colab.
- Google Colab can be used for R as well.
Python vs. R
What is Git?
\(\quad\)
- Git is the most popular version control tool for any software development.
- It tracks changes in a series of snapshots of the project, allowing developers to revert to previous versions, compare changes, and merge different versions.
- It is the industry standard and ubiquitous for coding collaboration.
What is GitHub?
GitHub is a web-based hosting platform for Git repositories to store, manage, and share code.
Our course website is hosted on a GitHub repository.
Course contents will be posted not only in Brightspace but also in my GitHub repositories (“repos”).
Github is useful for many reasons, but the main reason is how user friendly it makes uploading and sharing code.