Lecture 4

Governance and Climate Finance in the Developing World

Byeong-Hak Choe

SUNY Geneseo

September 21, 2026

Climate finance

Financial resources dedicated to mitigation and adaptation, including flows to developing countries.

Climate finance can differ along several dimensions:

  • domestic or international,
  • public or private,
  • bilateral or multilateral,
  • concessional or market-rate, and
  • committed or disbursed.

The boundary is contested. Different databases count different sources, instruments, and climate-relevant shares.

The meaning of “developing world”

Classification Typical rule Use in this lecture
UNFCCC Party group under the climate agreements Legal and negotiating context
OECD DAC Eligibility for official development assistance Development-finance reporting
World Bank Income group based on GNI per person Current descriptive sample

The classwork labels current low- and middle-income economies using the World Bank’s current LIC, LMC, and UMC codes.

Country groups change over time. A current classification should not be applied silently to a historical panel.

Climate policy purposes

Mitigation reduces greenhouse gas emissions or strengthens sinks.

Adaptation reduces exposure or vulnerability and strengthens resilience.

Cross-cutting finance supports both mitigation and adaptation.

Loss and damage finance addresses climate harms that communities cannot avoid through mitigation or adaptation alone.

Where would a solar mini-grid fit? What about a coastal flood-warning system?

Channels and instruments

Channels

Bilateral

A provider government finances a recipient directly.

Multilateral

Funds move through a climate fund, development bank, or international institution.

Instruments

Grant: no repayment

Concessional loan: below-market terms

Market-rate loan: repayment on commercial terms

Equity: ownership investment

Guarantee: protection against specified losses

Accounting verbs

Term Plain-language meaning
Commitment A formal promise or approved amount
Disbursement Money transferred during a period
Provided Public finance reported as supplied
Mobilized Private finance attributed to a public intervention
Project cost Full financing package, often larger than climate finance

Never combine these amounts without checking the source method, timing, currency basis, and overlap rules.

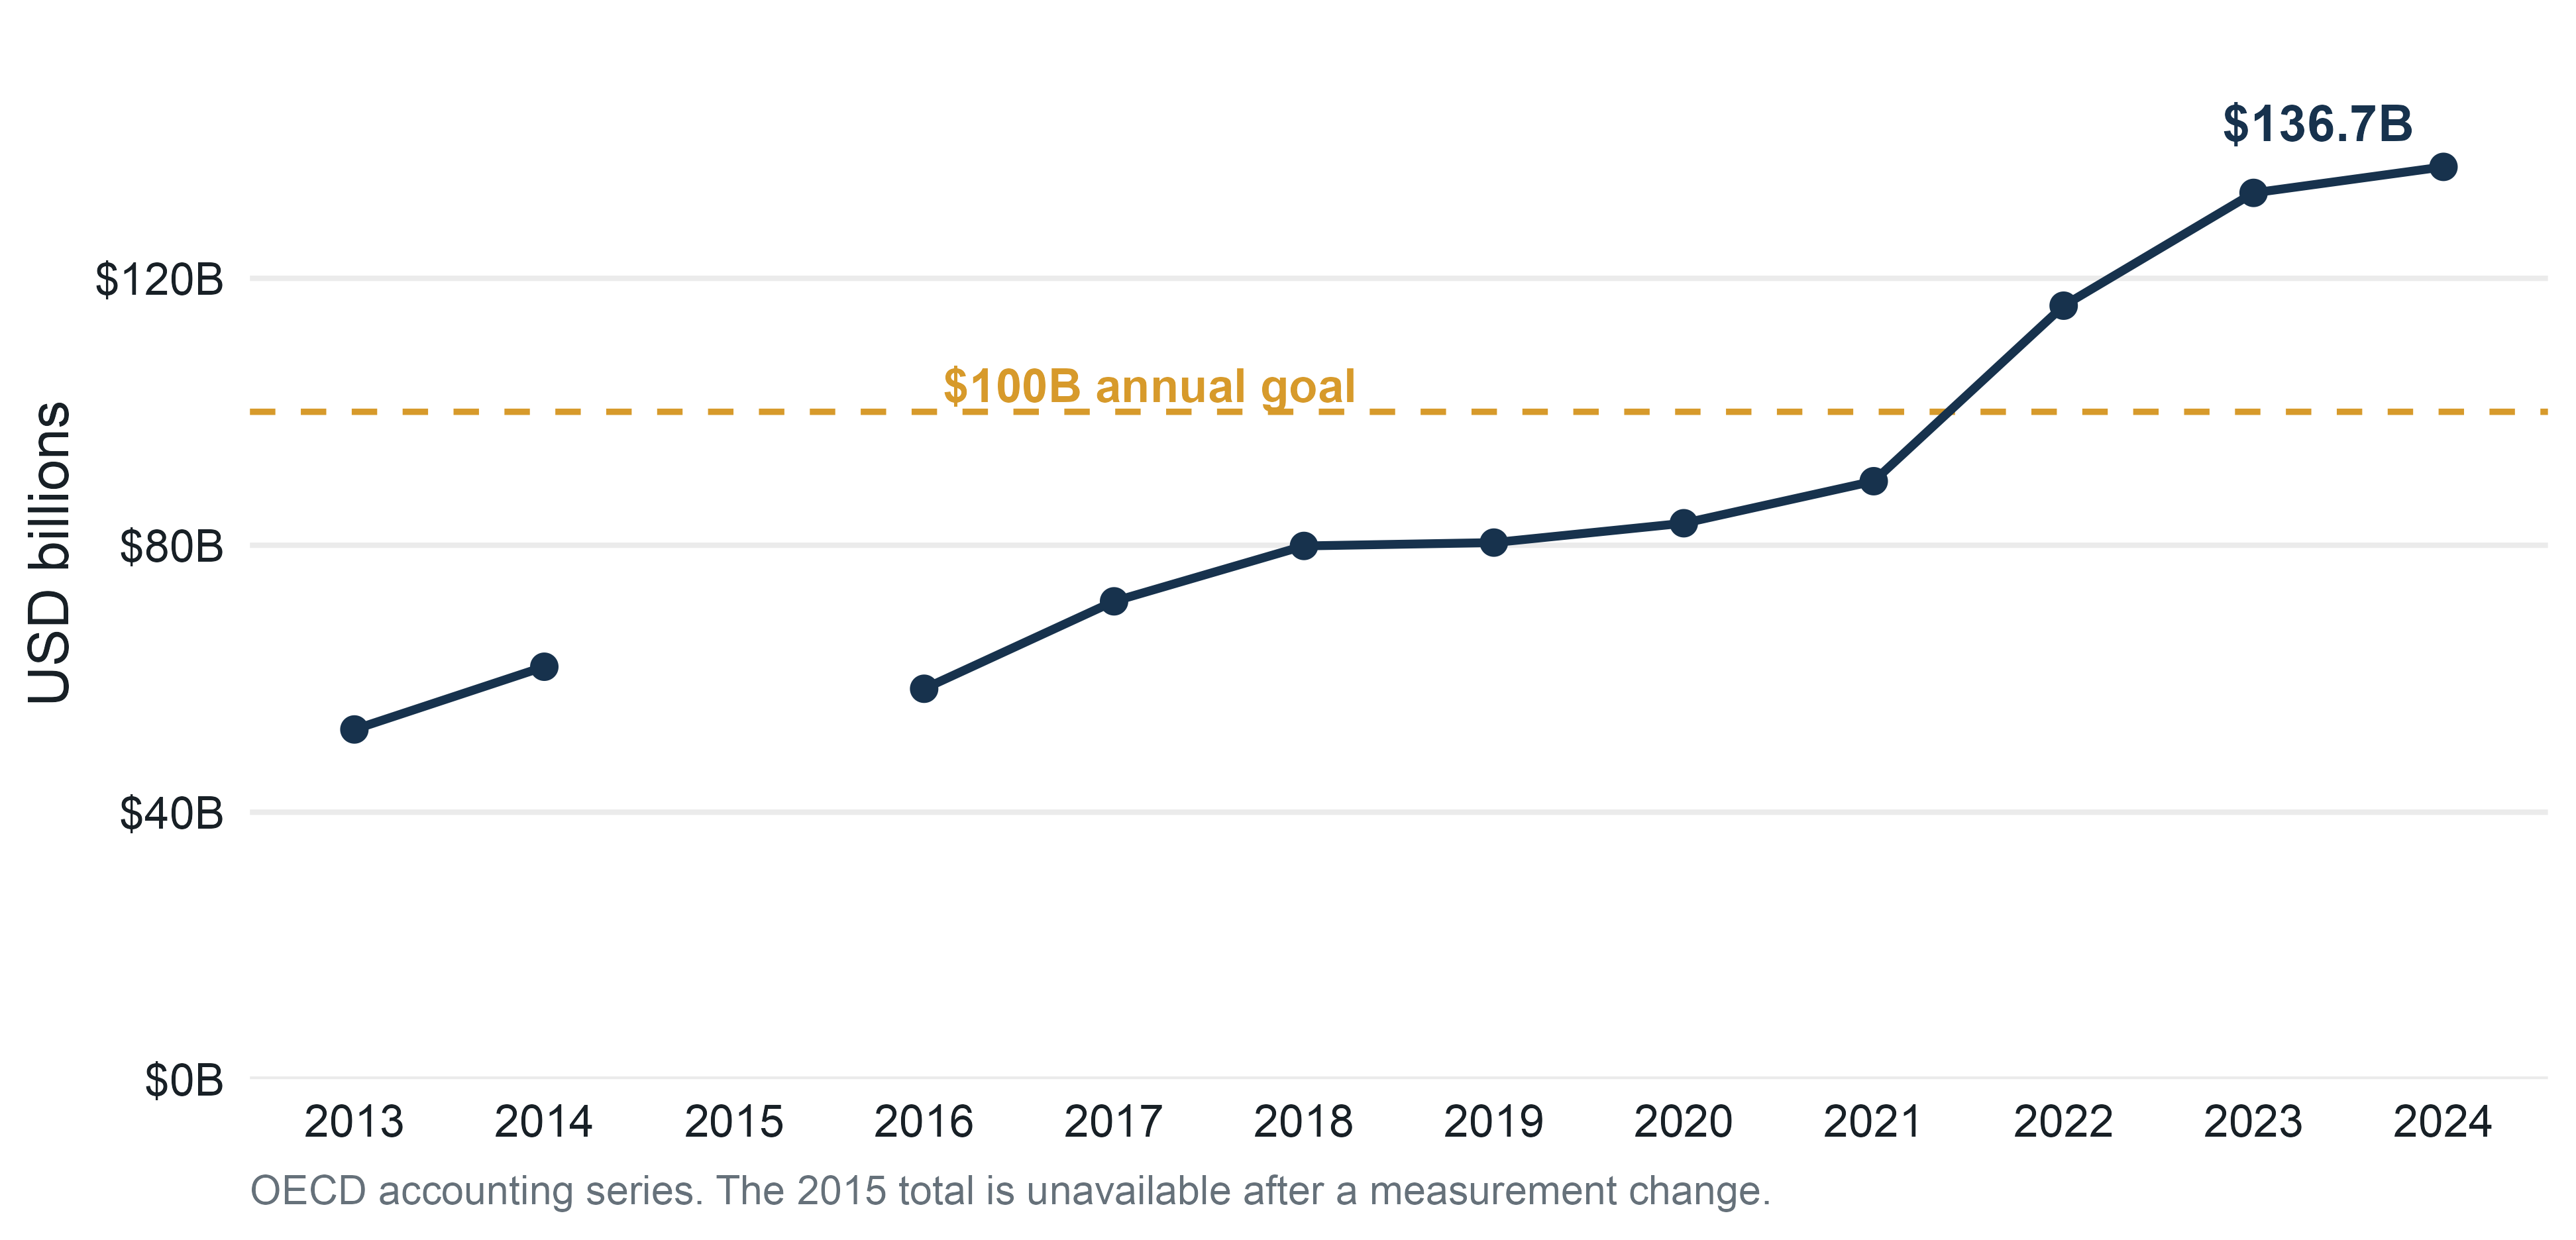
Climate finance reached $136.7 billion in 2024

Climate finance goals after 2025

$300B

At least this amount per year by 2035 for developing-country climate action, with developed countries taking the lead.

$1.3T

A broader effort by all actors to scale public and private finance per year by 2035.

The goals differ in responsibility and scope. Both exceed the 2024 OECD total.

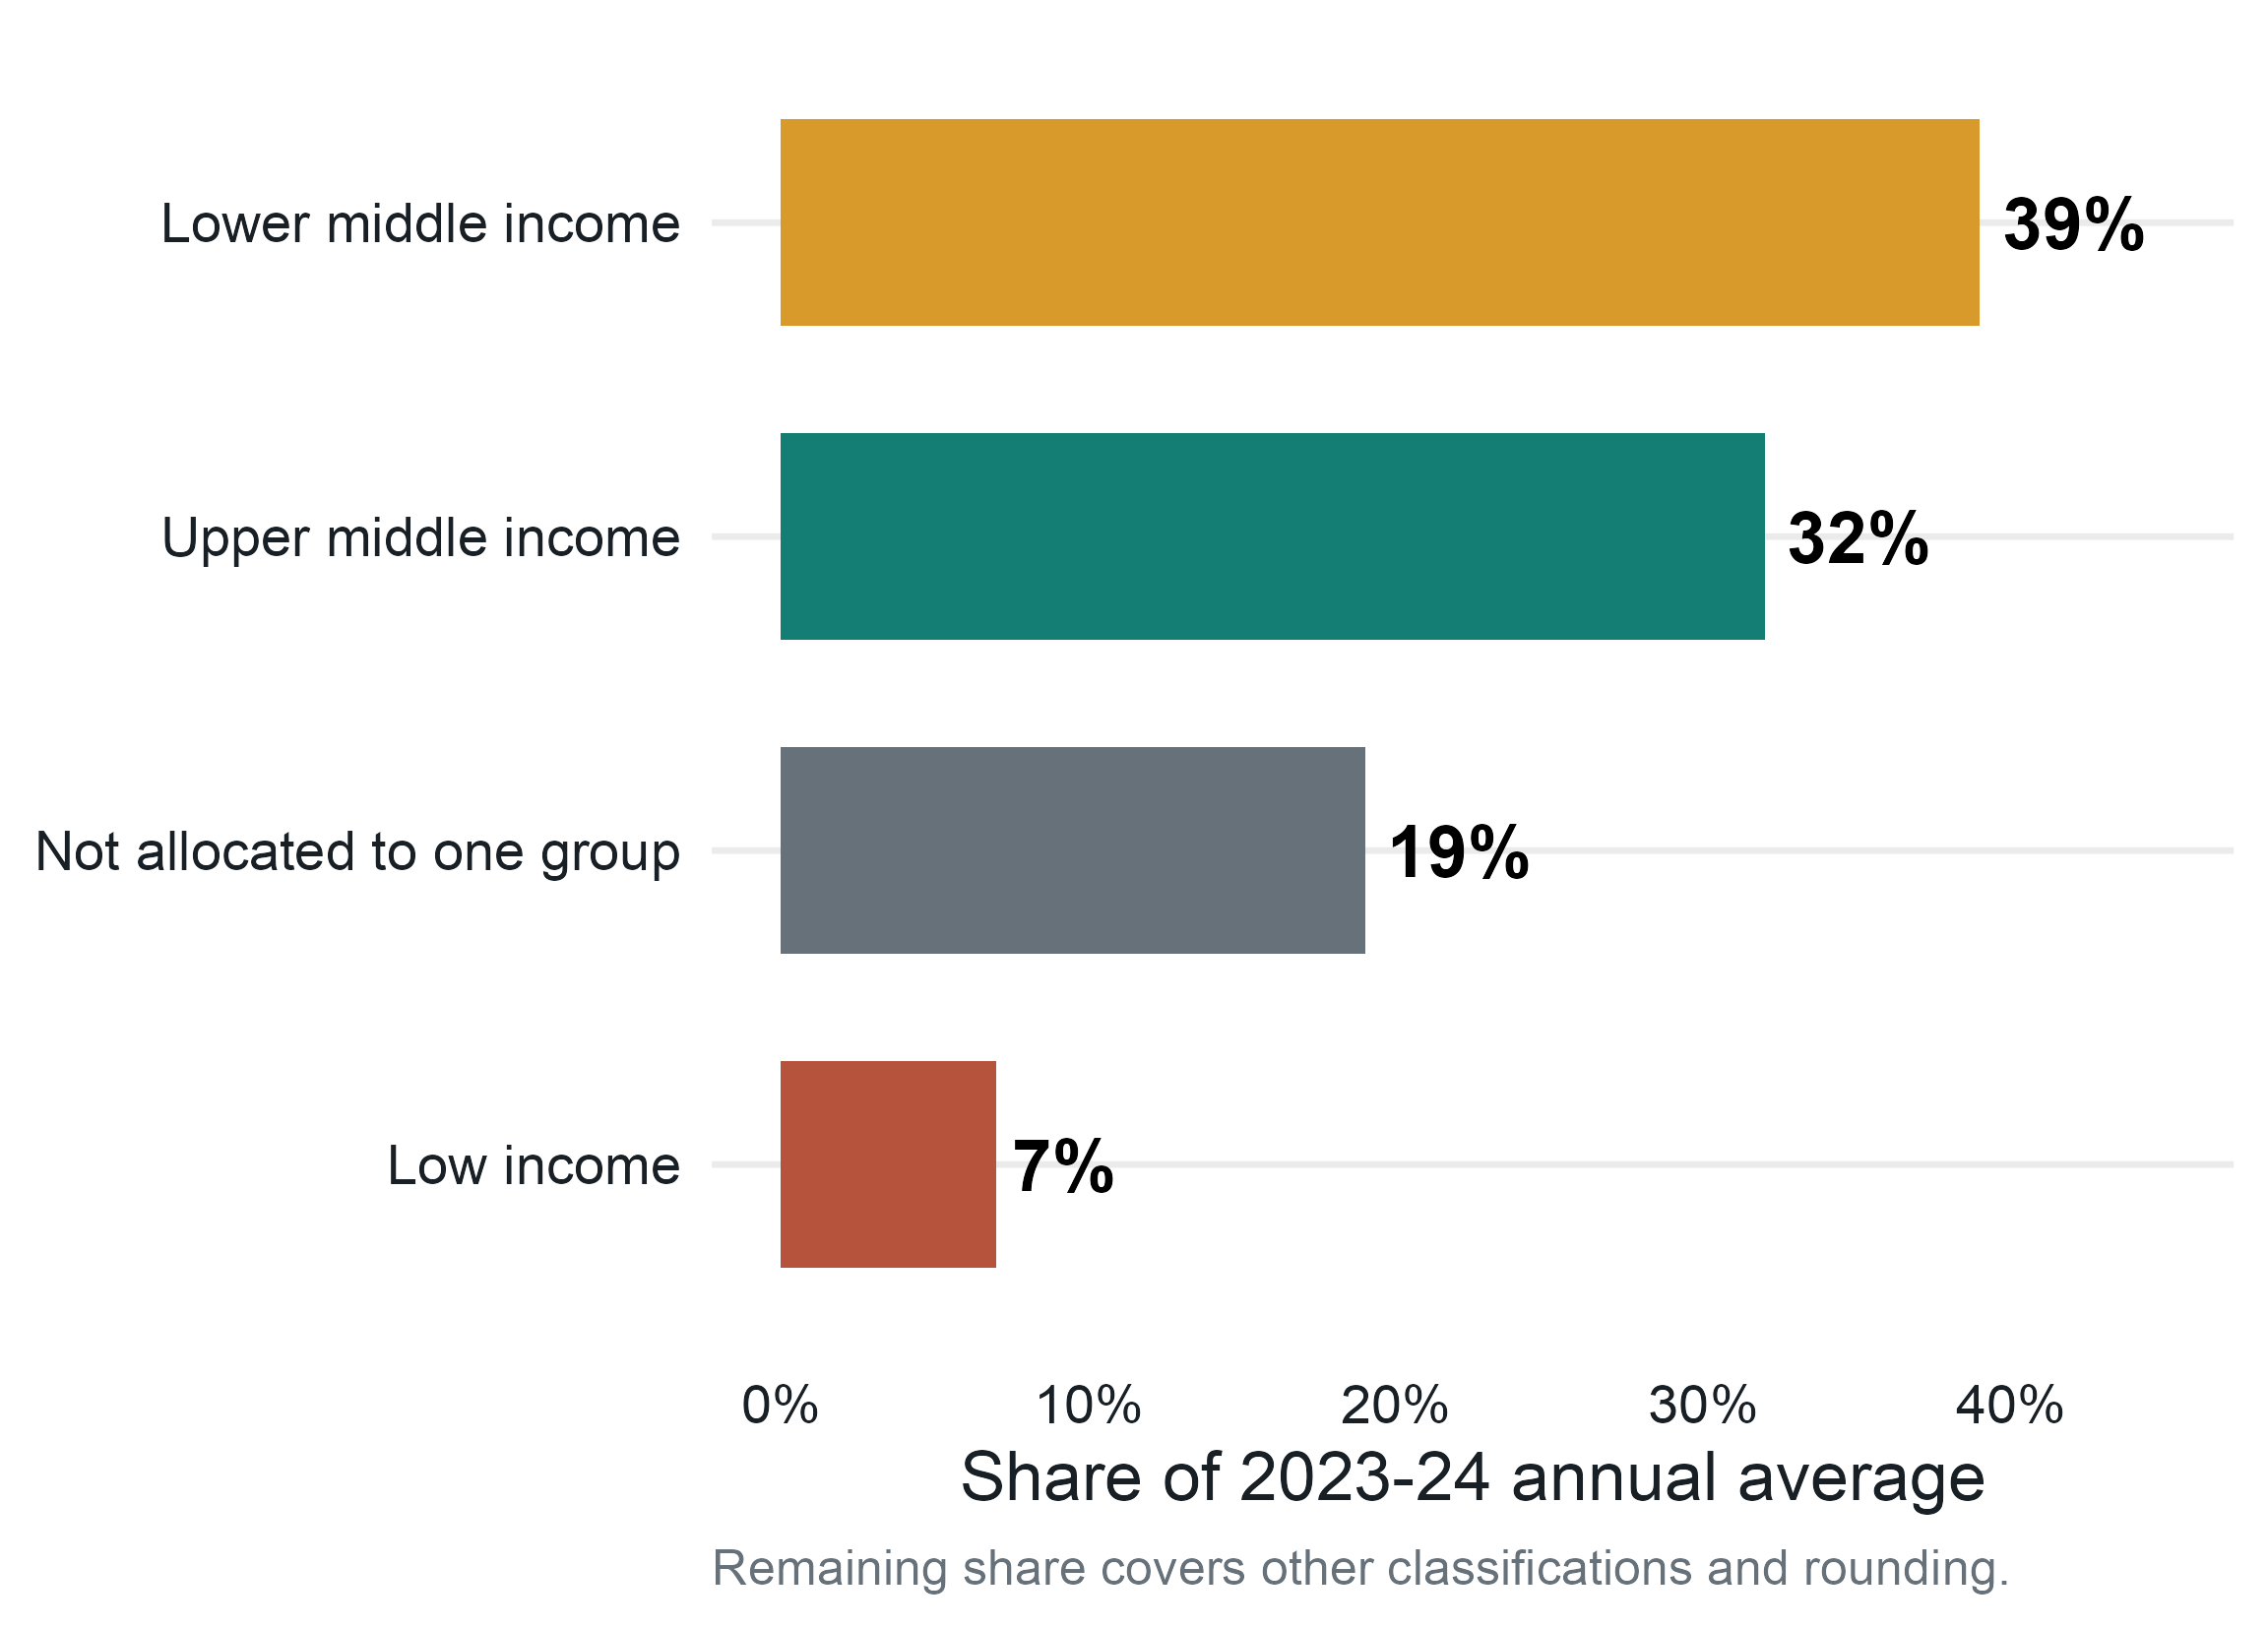
Recent finance remains concentrated in middle-income economies

income_distribution |>
  ggplot(
  aes(share, group, fill = group)
  ) +
  geom_col(show.legend = FALSE) +
  geom_text(
    aes(label = paste0(share, "%")),
    hjust = -0.15,
    fontface = "bold"
  ) +
  scale_fill_manual(
    values = income_plot_palette
  ) +
  scale_x_continuous(
    limits = c(0, 45),
    labels = label_percent(
      scale = 1
    )
  ) +
  theme_climate(14)

An allocation decision

Country A

High climate vulnerability

Limited procurement staff

Uncertain contract enforcement

Large adaptation need

Country B

Moderate climate vulnerability

Experienced project unit

Credible regulation

Investment-ready energy plan

Which country is more likely to receive finance? Which allocation better serves climate justice?

Governance

The World Bank defines governance as the traditions and institutions through which authority is exercised.

This broad concept covers:

  • how governments are selected and monitored,
  • the capacity to formulate and implement policy, and
  • respect for the institutions that organize social and economic interaction.

Governance quality is multidimensional. One score cannot describe every institutional constraint.

Six Worldwide Governance Indicators

Voice and Accountability

Participation, information, oversight, and media

Political Stability

Risk of violent or unconstitutional changes in authority

Government Effectiveness

Public services, civil service, and policy implementation

Regulatory Quality

Capacity to design and implement regulation

Rule of Law

Contract enforcement, property rights, courts, and public order

Control of Corruption

Use of public power for private gain

Governance scores contain uncertainty

WGI scores combine perception data from household surveys, firm surveys, and expert assessments.

Each country score has a model-based uncertainty interval.

Small score differences may not represent meaningful institutional differences.

The 2025 revision changed source screening, indicator mapping, and the aggregation model. It also recalculated the historical series.

Use WGI for broad comparisons. Country-specific reform needs country-specific diagnostics.

Governance and project risk

  1. Implementation capacity affects procurement, permitting, and reporting.

  2. Legal credibility affects contract enforcement and the risk of renegotiation.

  3. Accountability affects monitoring, leakage, and local trust.

  4. Policy stability affects long-lived investments with large upfront costs.

These mechanisms can influence both project success and a funder’s willingness to allocate money.

The allocation dilemma

Stronger implementation capacity Weaker implementation capacity
High climate need High readiness and high need Greatest access challenge
Lower climate need Bankable but less urgent Lower priority on both dimensions

Should finance reward readiness, compensate for vulnerability, or build capacity before funding large projects?

The study behind this lecture

Question

Which recipient-country characteristics are associated with climate finance contributions, especially for energy projects?

Main period

2011-2019. The authors exclude 2020 from the estimation period because of pandemic disruption.

Methods

Random forests, LASSO, and supporting OLS specifications.

Outcome

Dollar contribution assigned to a project, recipient, sector, contributor, and year record.

From projects to analytical rows

16,804 reported projects → sectors, recipient countries, and contributors → 52,833 analytical records

The research archive divides a project’s contribution equally when it lists multiple recipients or sectors.

The lecture sample retains 30,530 low- and middle-income recipient-sector rows for 2011-2020 and removes proprietary Political Risk Services (PRS) variables.

The row grain determines which money column can be summed.

A project allocation example

$12 million ÷ (2 recipient countries × 3 sectors)

= $2 million per country-sector row

Summing the full $12 million on all six rows would report $72 million.

Summing the allocated field reconstructs $12 million.

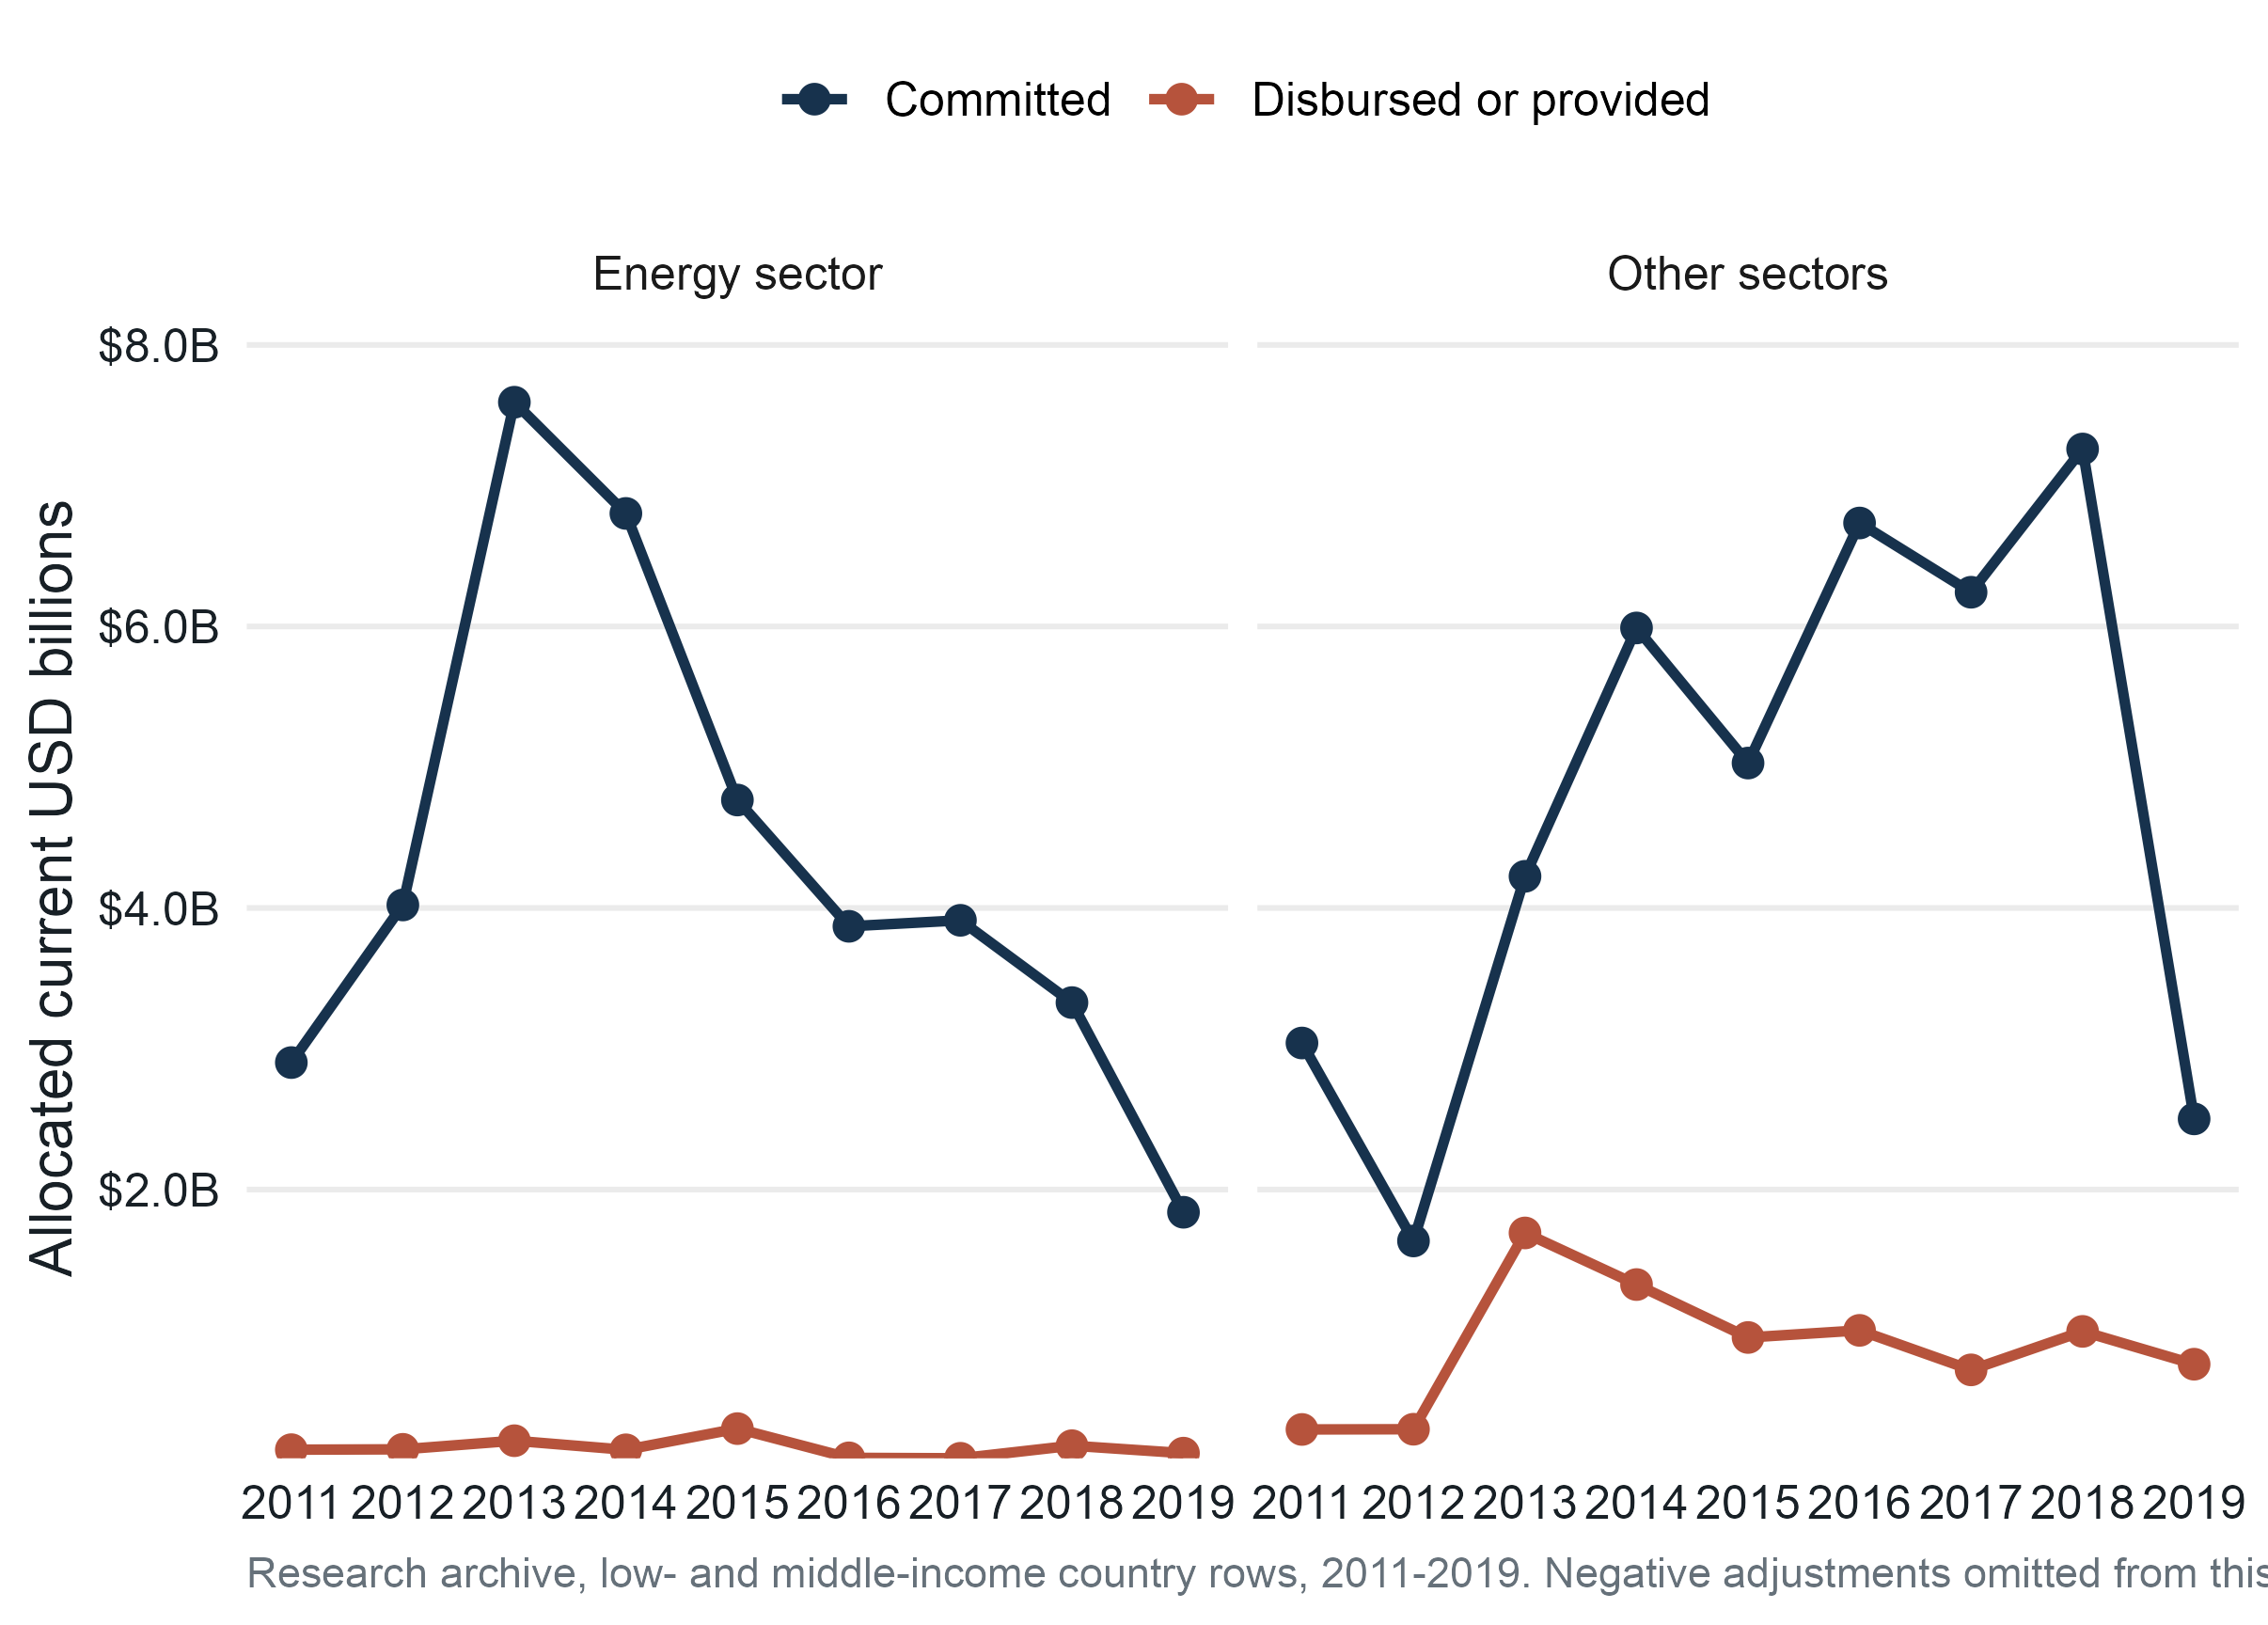
Commitments exceed reported provision in the archive

paper_status |>
  ggplot(aes(
    year,
    usd_billion,
    color = status_group
  )) +
  geom_line(linewidth = 1.05) +
  geom_point(size = 2.5) +
  facet_wrap(~ project_group, nrow = 1) +
  scale_y_continuous(
    labels = label_dollar(
      suffix = "B", accuracy = 0.1
    )
  ) +
  theme_climate(12.5)

Climate finance has a long right tail

Project record Mean contribution Median contribution
Energy sector $5.72 million $410,000
Other sectors $1.81 million $102,631

Large projects pull the mean far above the median.

Useful descriptive choices include medians, quantiles, log scales, and transparent treatment of negative adjustments.

An average project record does not describe a typical project record when the distribution is highly skewed.

Findings from the paper

For energy-project records, the selected models associate larger contributions with several governance measures, including:

  • rule of law,
  • legislative strength,
  • voice and accountability, and
  • popular support.

Grant status is the strongest random-forest predictor in the reported model. Energy status and several trade, resource, and economic-risk variables also rank highly.

Variable importance gives predictive usefulness. It gives neither direction nor a causal effect.

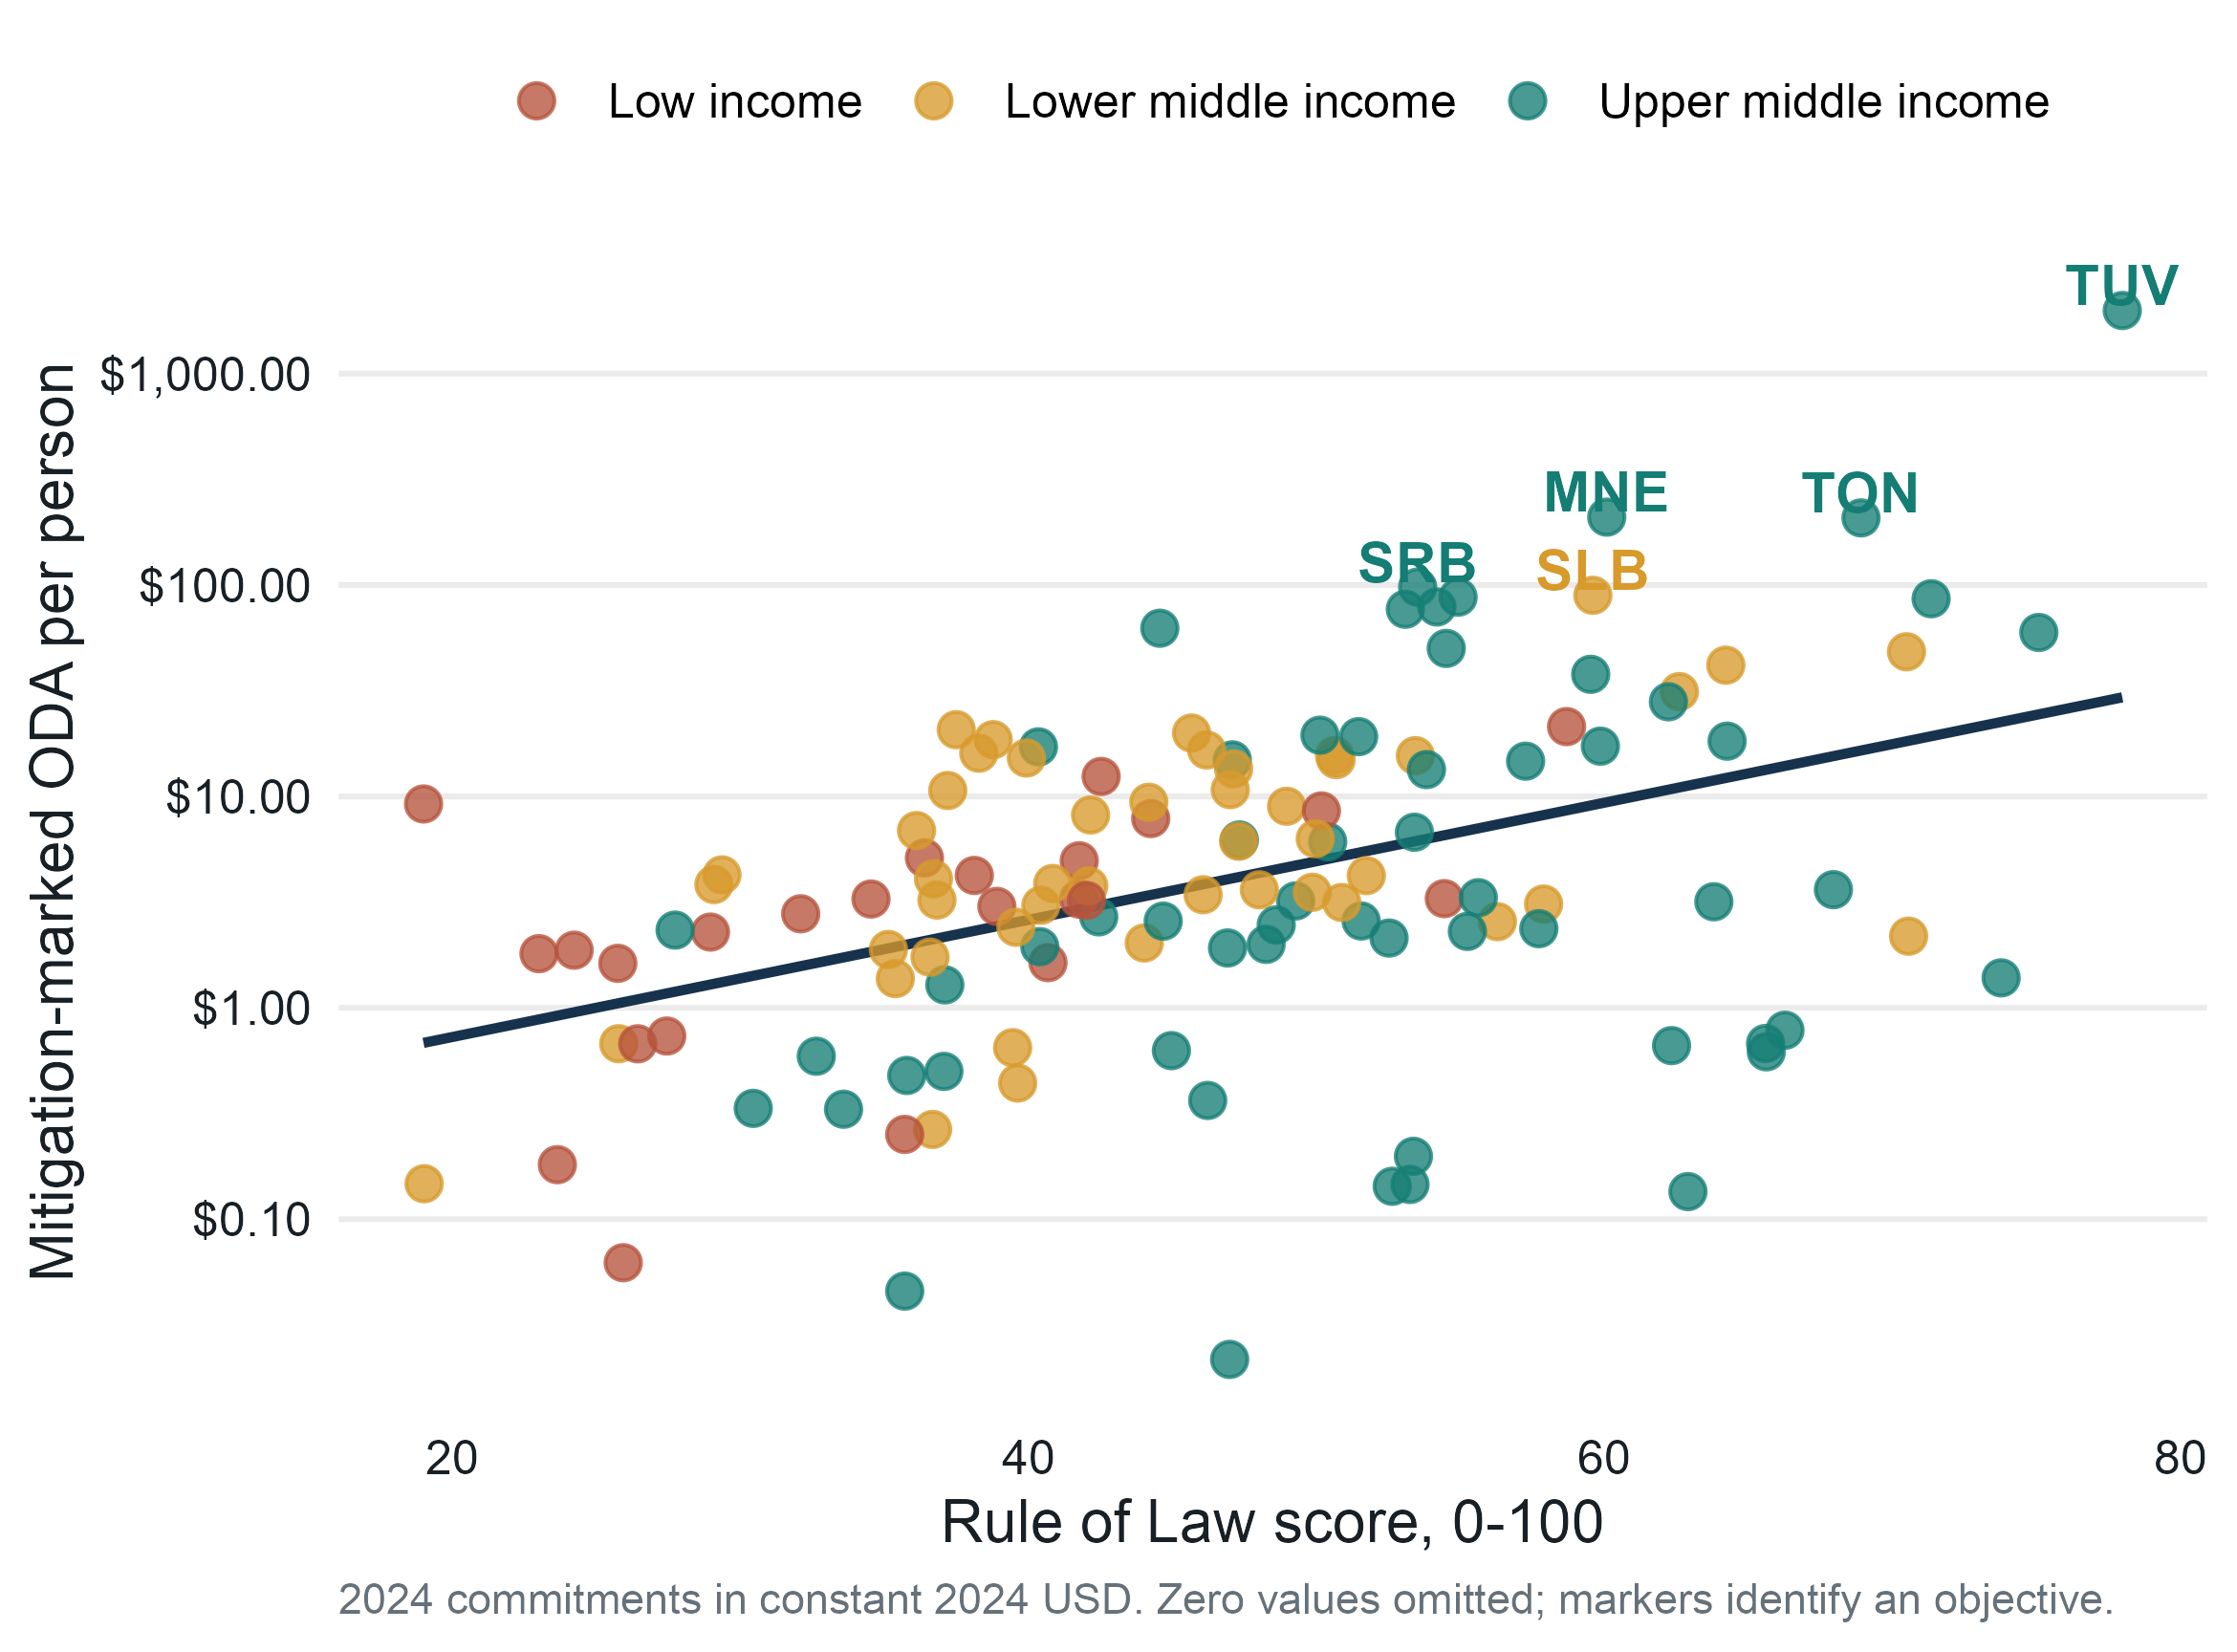
A matched 2024 descriptive dataset

The reproducible pipeline combines:

Source 2024 measure
OECD SDMX API Bilateral allocable ODA commitments with a mitigation Rio marker
World Bank WGI API Rule of Law and five other governance dimensions
World Bank WDI API Population, GDP per person, electricity access, energy use, and GHG emissions

The sample contains current low- and middle-income economies and uses one common year for the displayed comparison.

Rio-marked ODA is a transparent current proxy. It is narrower than total climate finance and should be labeled accordingly.

Four readings of the same pattern

Risk channel

Funders may prefer settings with more predictable implementation.

Readiness channel

Countries with prepared proposals can secure more commitments.

Demand channel

Country size, energy demand, and project pipelines affect funding.

Selection and measurement

Only reported activities appear, and governance scores contain uncertainty.

The scatterplot supports a question. It does not choose among these explanations.

Main takeaways

  • Climate finance totals depend on accounting boundaries.

  • Governance can affect project risk, readiness, and perceived implementation capacity.

  • A country-sector row needs an allocated contribution before aggregation.

  • Current data show patterns that require several competing explanations.

How could a funding system manage project risk without excluding countries with the greatest institutional constraints?