Lecture 13
Shiny Web Applications
May 5, 2025
Deploying and Sharing—Step 3
- Build the application
- Copy and paste the code below into
app.R. - Preview the application: In RStudio when looking at
app.R, click the Run App button at the top-right corner of the Script Pane. This previews your application locally. - Add dependency file: Run
rsconnect::writeManifest()in R Console.- This function creates
manifest.jsonthat will tell Connect Cloud (1) what version of R to use and (2) what packages and versions are required.
- This function creates
- Copy and paste the code below into
library(shiny)
library(tidyverse)
library(viridis)
faithful <- as_tibble(datasets::faithful[, 2])
# Define UI for application that draws a histogram
ui <- fluidPage(
# Application title
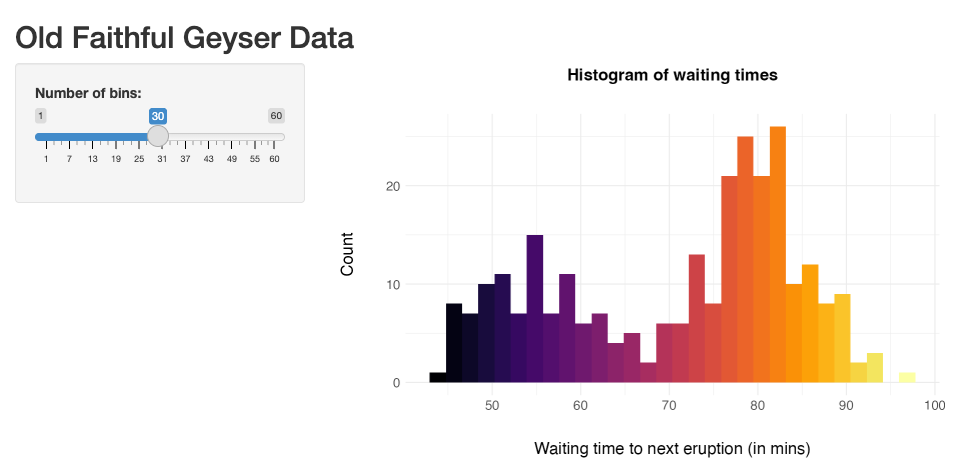
titlePanel("Old Faithful Geyser Data"),
# Sidebar with a slider input for number of bins
sidebarLayout(
sidebarPanel(
sliderInput(inputId = "bins",
label = "Number of bins:",
min = 1,
max = 60,
value = 30)
),
# Show a plot of the generated distribution
mainPanel(
plotOutput("distPlot")
)
)
)
# Define server logic required to draw a histogram
server <- function(input, output) {
output$distPlot <- renderPlot({
v_colors <- viridis(input$bins,
alpha = 1,
begin = 0,
end = 1,
direction = 1, option = "B")
ggplot(faithful, aes(x = value)) +
geom_histogram(bins = input$bins,
fill = v_colors) +
labs(x = 'Waiting time to next eruption (in mins)',
y = "Count",
title = 'Histogram of waiting times') +
theme_minimal() +
theme(plot.title = element_text(hjust = 0.5,
size = rel(1.5),
face = 'bold',
margin =
margin(0,0,30,0)),
axis.title.x = element_text(size = rel(1.5),
margin =
margin(30,0,0,0)),
axis.title.y = element_text(size = rel(1.5),
margin =
margin(0,30,0,0)) ,
axis.text.x = element_text(size = rel(1.5)),
axis.text.y = element_text(size = rel(1.5)) )
})
}
# Run the application
shinyApp(ui = ui, server = server)