Lecture 12
Quarto Dashboards
April 30, 2025
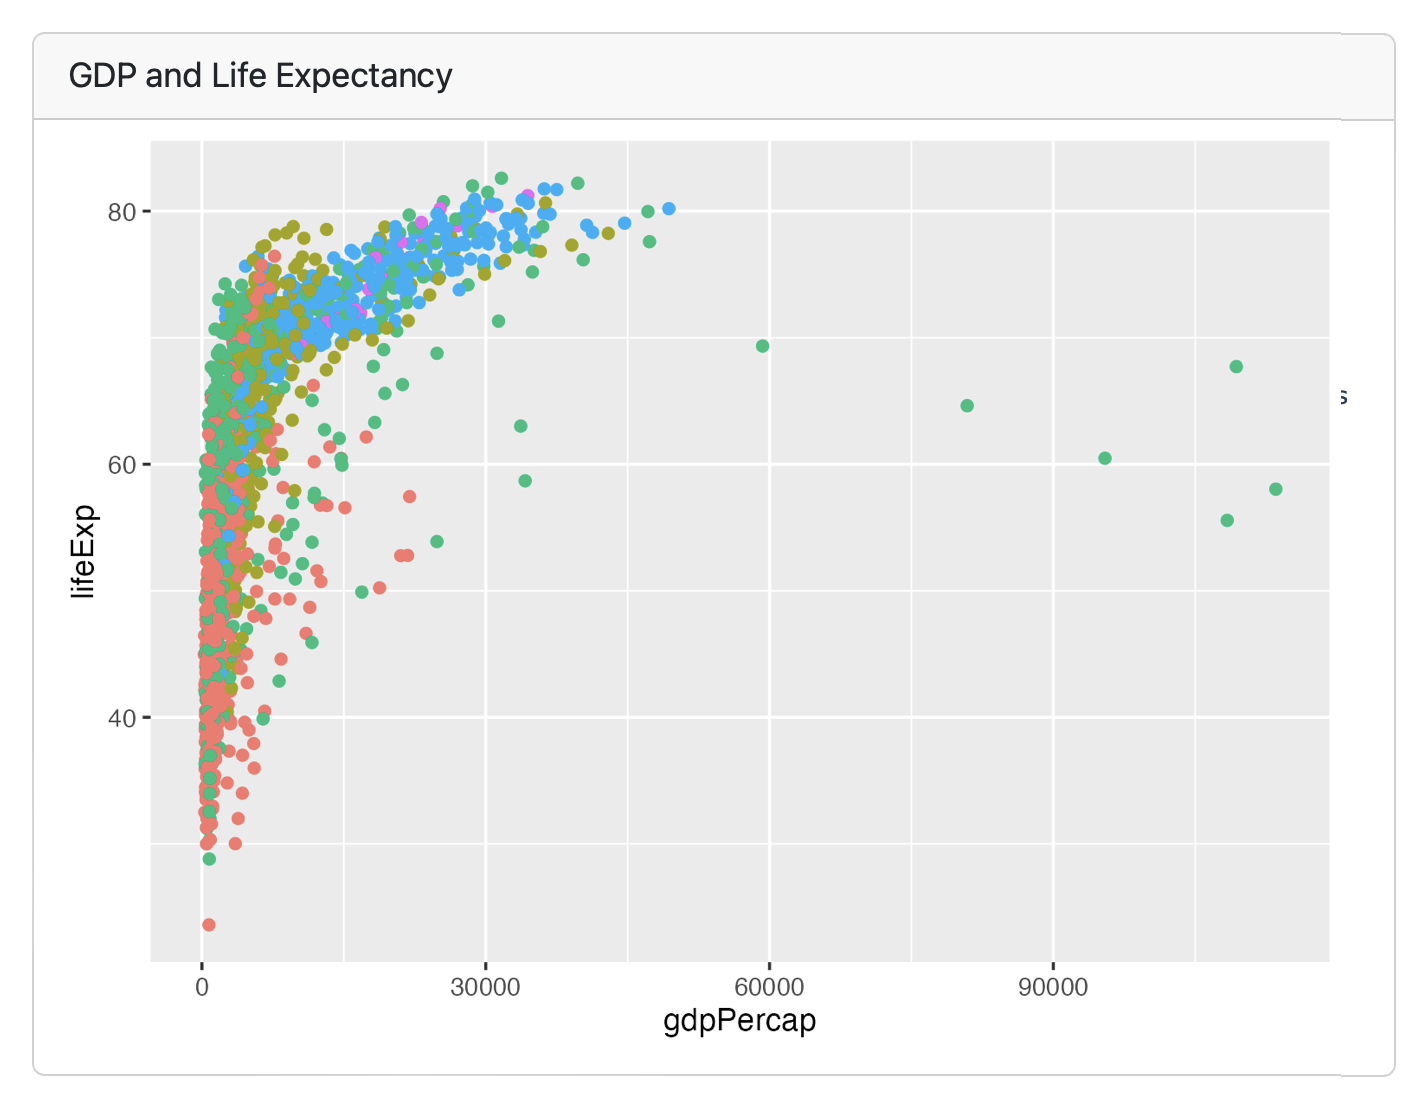
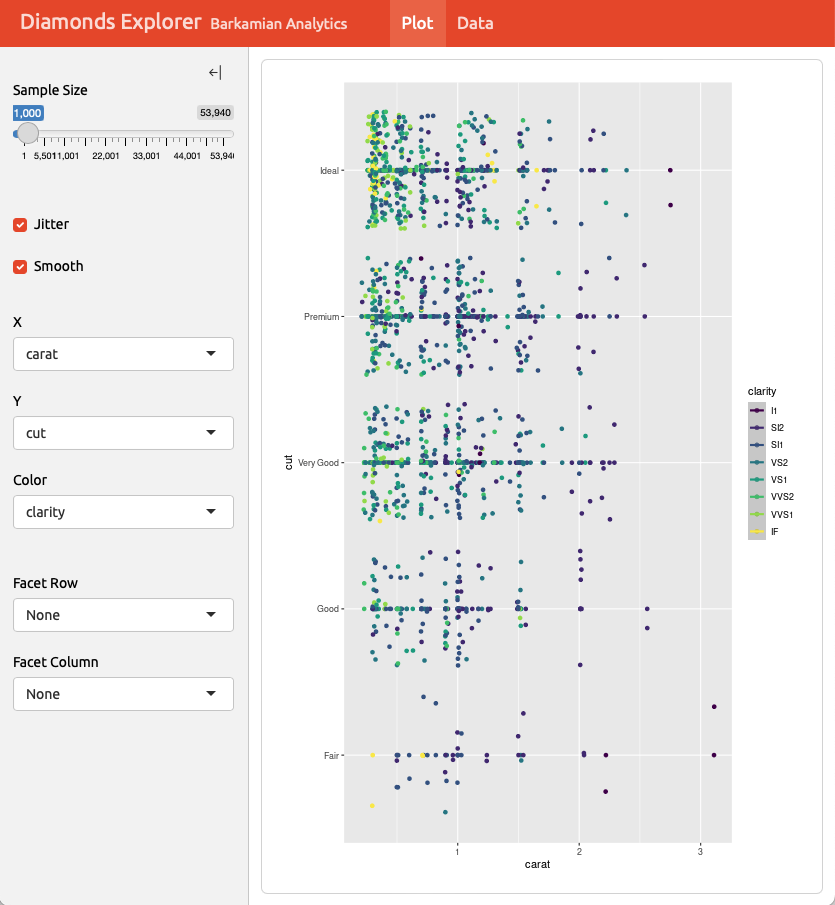
Plots
Each code chunk makes a card, and can take a title
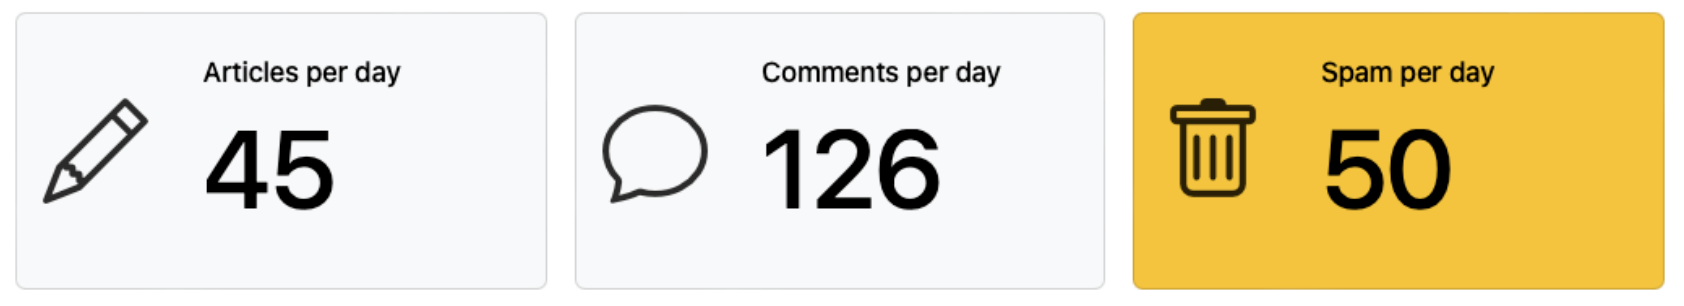
Value Boxes
- Value boxes are a great way to prominently display simple values within a dashboard. For example, here is a dashboard row with three value boxes:
Navigation Bar and Pages

Sidebars: Page Level
Sidebars: Global
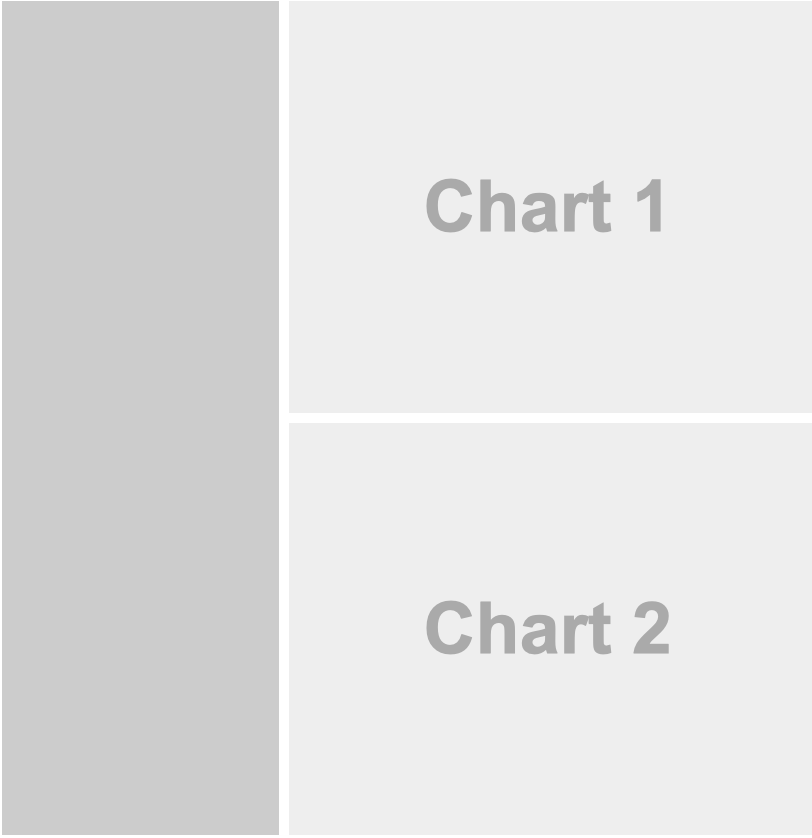
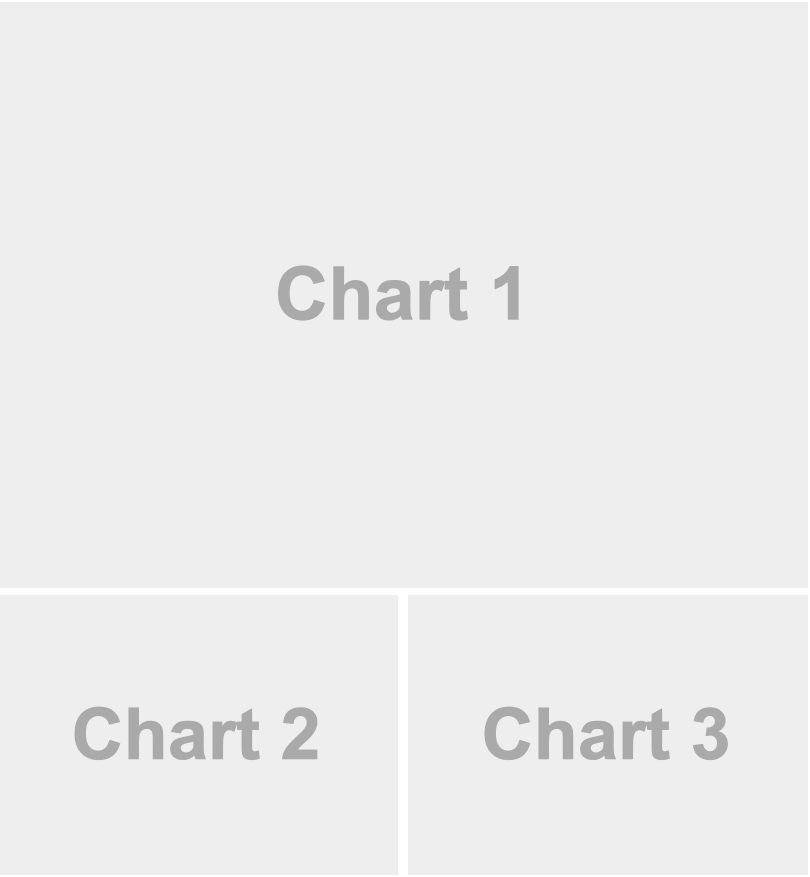
Layout: Rows
Layout: Columns

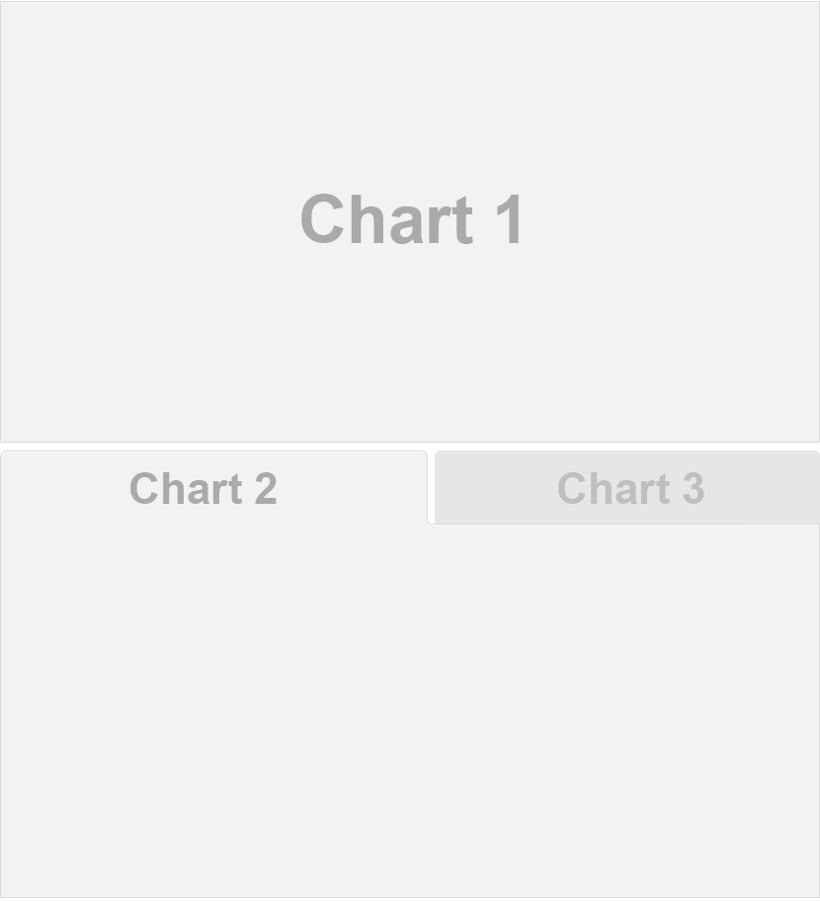
Tabset
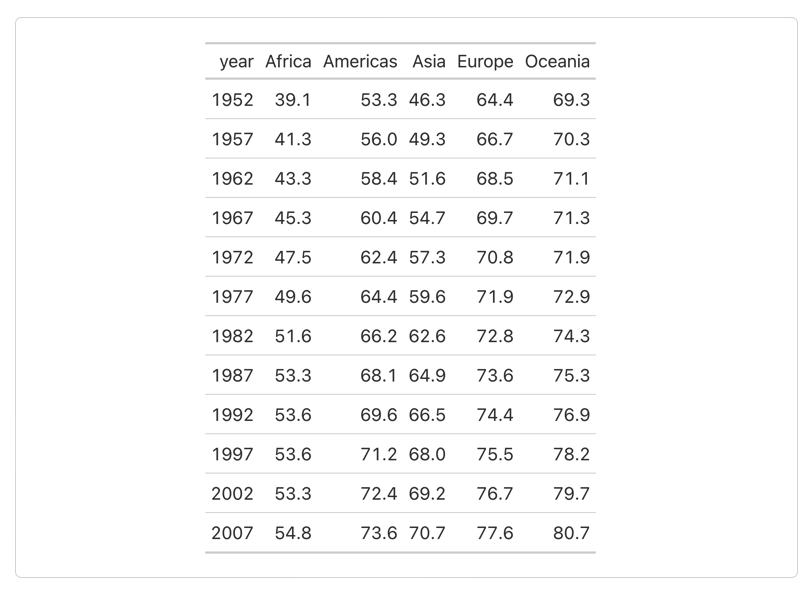
Tables
Each code chunk makes a card, doesn’t have to have a title