Lecture 10

Quarto Dashboards; Shiny Web Applications

Byeong-Hak Choe

SUNY Geneseo

April 29, 2026

🖥️ Quarto Dashboards

Quarto Dashboards

What is a dashboard?

Quarto Dashboards

A new output format for easily creating
dashboards from .qmd files

.qmd âžť Dashboard

---
title: "Dashing through the snow ❄️"
format: dashboard
---

# content goes here...

Quarto Dashboards

Dashboard Basics

  • Dashboards are composed of cards
  • Cards are arranged into rows and columns
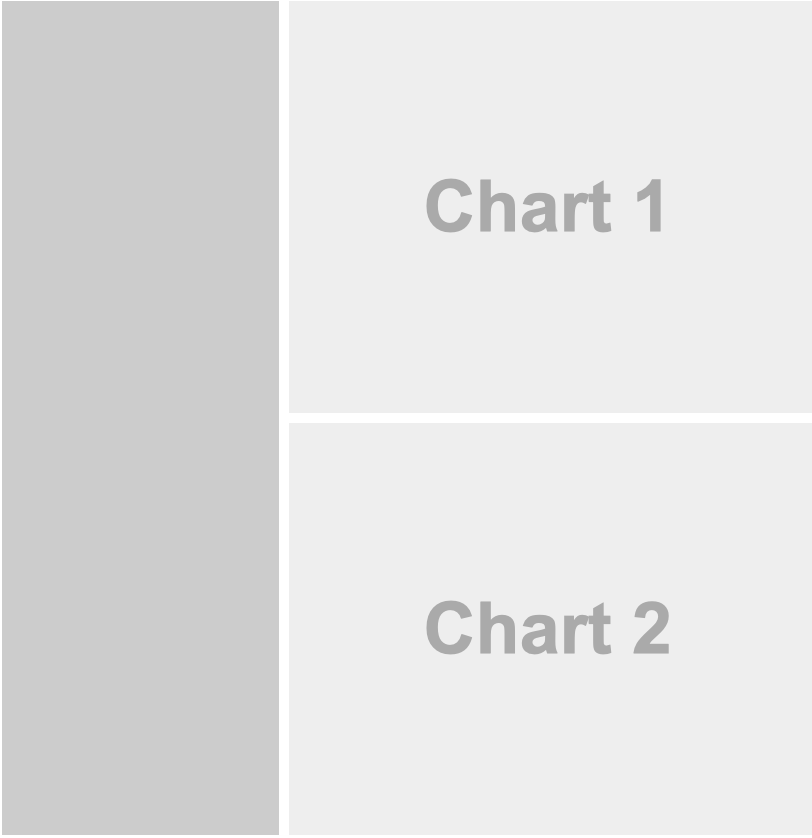
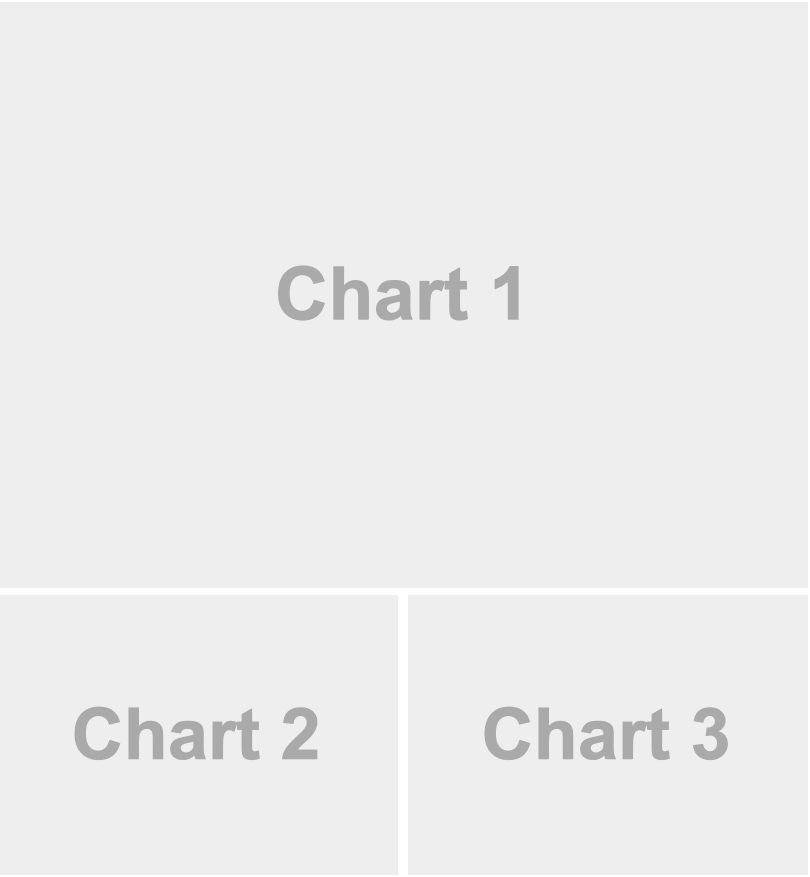
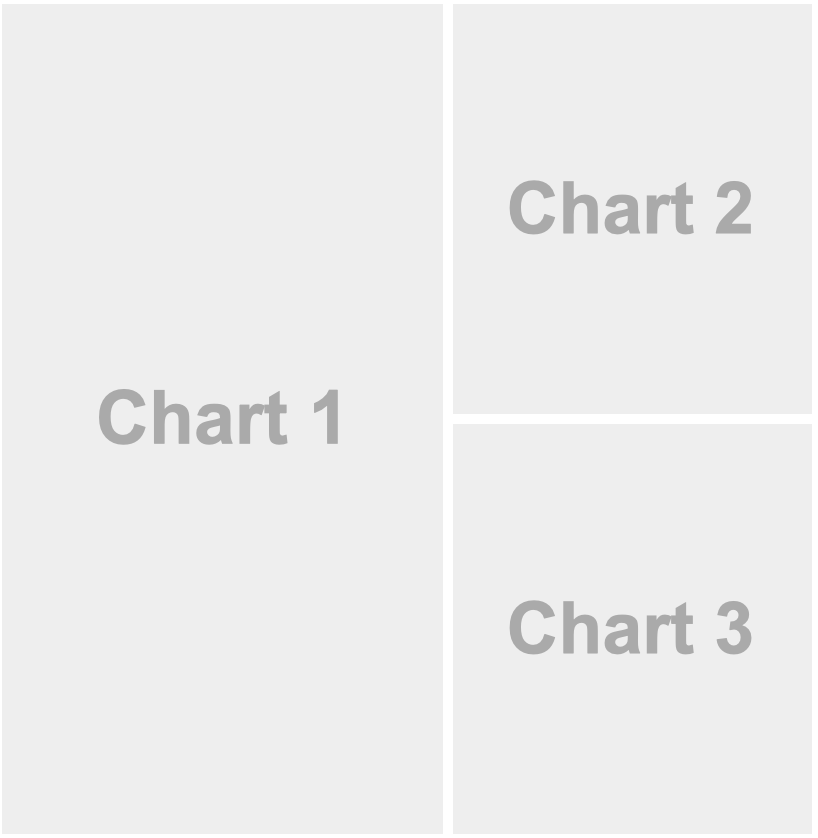
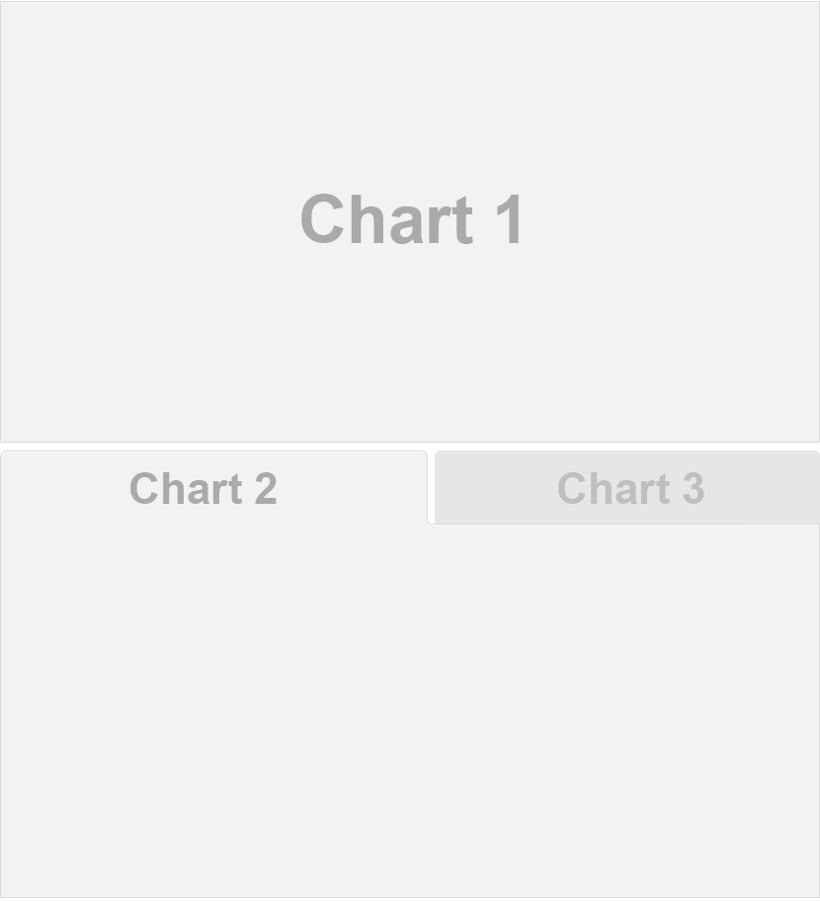
  • Pages, tabsets, and sidebars allow more advanced layouts

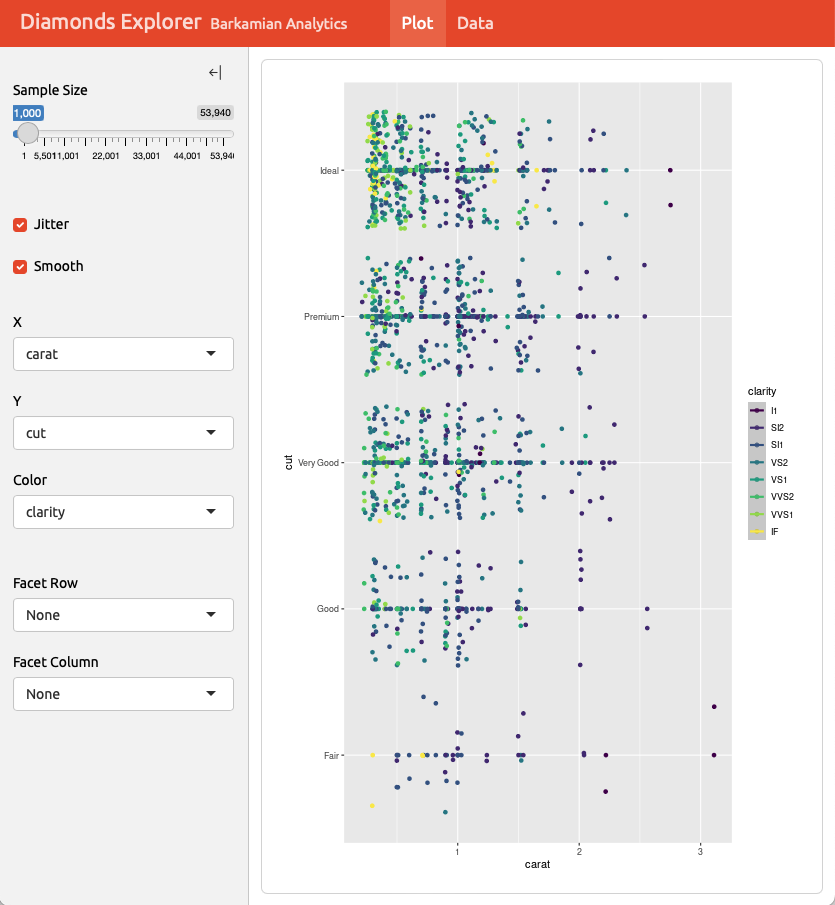
With these simple building blocks, it is pretty straightforward to build some cool dashboards…

Dashboard Basics

--- 
title: My Dashboard
author: Your Name
format:
  dashboard
---

```{r}
library(tidyverse)
```

```{r}

```

Plots

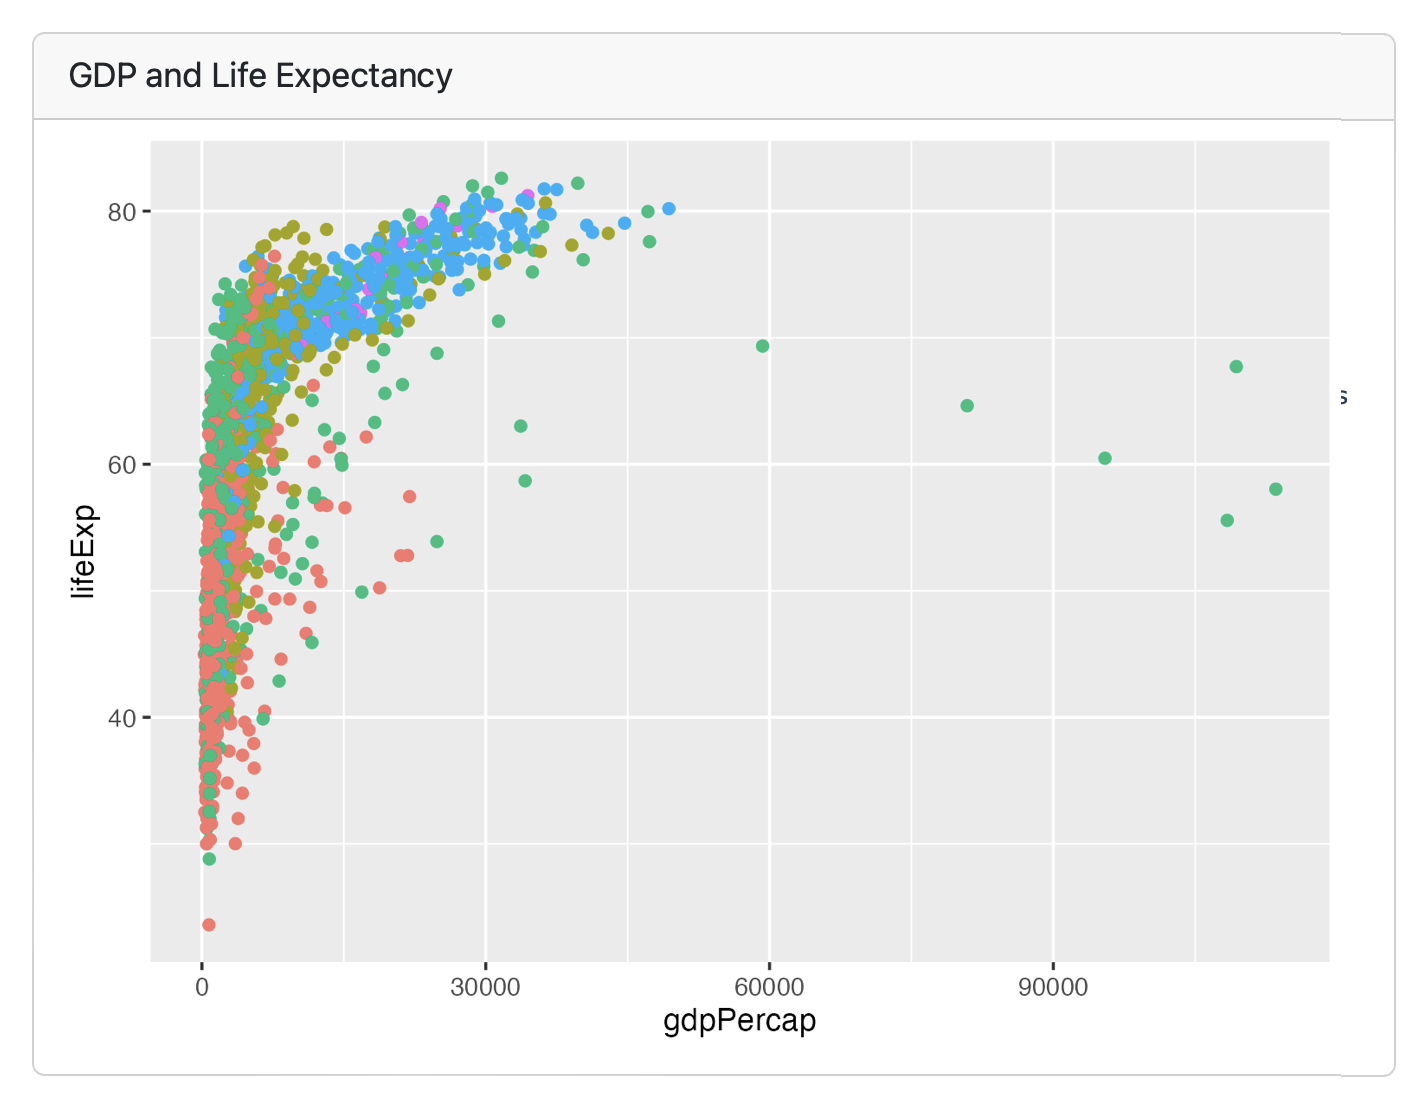
Each code chunk makes a card, and can take a title

```{r}
#| title: GDP and Life Expectancy

library(gapminder)
library(tidyverse)
ggplot(gapminder, 
       aes(x = gdpPercap, 
           y = lifeExp, 
           color = continent)) +
  geom_point()
```

Value Boxes

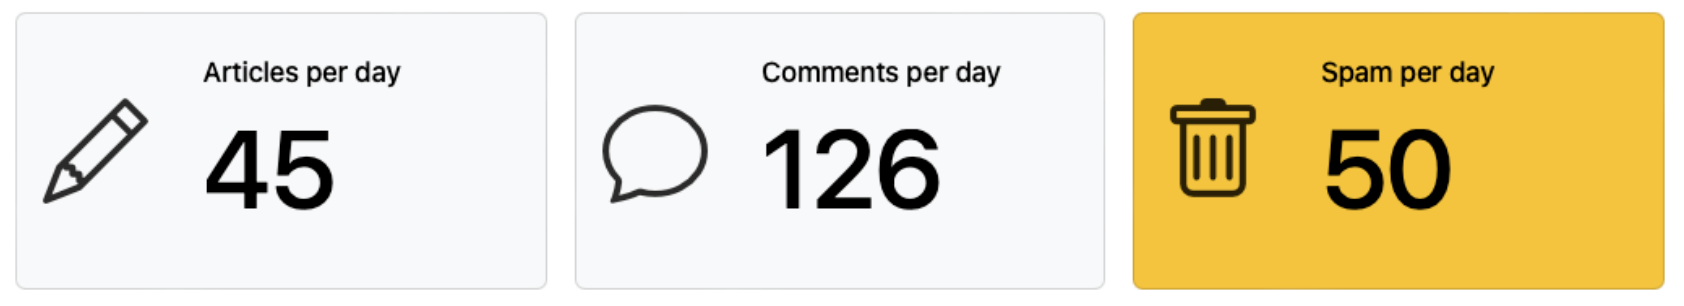
  • Value boxes are a great way to prominently display simple values within a dashboard. For example, here is a dashboard row with three value boxes:

Value Boxes

```{r}
#| content: valuebox
#| title: "Spam per day"

list(
  icon = "trash",
  color = "danger",
  value = spam
)
```

Value Boxes

icon and color

  • The icon used in value boxes can be any of the 2,000 available bootstrap icons.

  • The color can be any CSS color value, however there are some color aliases that are tuned specifically for dashboards that you might consider using by default:

  • primary: Blue
  • secondary: Gray
  • success: Green
  • info: Bright Blue
  • warning: Yellow/Orange
  • danger: Red
  • light: Light Gray
  • dark: Black

Layout: Rows

---
title: "Focal (Top)"
format: dashboard
---
    
## Row {height=70%}

```{r}
```

## Row {height=30%}

```{r}
```

```{r}
```

Layout: Columns

---
title: "Focal (Top)"
format: 
  dashboard:
    orientation: columns
---
    
## Column {width=60%}

```{r}
```

## Column {width=40%}

```{r}
```

```{r}
```

Tabset

---
title: "Palmer Penguins"
format: dashboard
---
## Row
```{r}
```

## Row {.tabset}

```{r}
#| title: Chart 2
```

```{r}
#| title: Chart 3
```

Tables

Each code chunk makes a card, doesn’t have to have a title

```{r}
library(gapminder)
library(tidyverse)
library(gt)

gapminder |>
  group_by(continent, year) |>
  summarize(mean_lifeExp = 
              round(mean(lifeExp), 1)) |>
  pivot_wider(names_from = continent, 
              values_from = mean_lifeExp) |>
  gt()
```

Other features

  • Text content

  • Expanding cards

Dashboard deployment

Dashboards are typically just static HTML pages so can be deployed to any web server or web host!

Interactive Dashboards

https://quarto.org/docs/dashboards/interactivity/shiny-r

  • For interactive exploration, some dashboards can benefit from a live R backend

  • To do this with Quarto Dashboards, add interactive Shiny components

  • Deploy with or without a server!

Learn more

https://quarto.org/docs/dashboards

✨ What is Shiny and What is It Good for?

A Web Application Framework

  • Shiny is a web application framework in R and Python.
    • We use R for Shiny app development.
install.packages(c("shiny", "rsconnect", "plotly", "DT", "viridis"))
  • We can build web apps without knowing HTML/CSS/Javascript!
  • The whole R/Python package ecosystem is available for use in your web app!

Use Cases and Examples

How Can We Deploy and Share a Shiny App?

Deploying and Sharing

  • Shiny apps can be run locally using the shiny R package.

  • You can run a free version of Shiny Server on your own system, or pay for the full-featured Posit Connect Cloud platform.

Deploying and Sharing—Step 1

  • Create a new GitHub repository.
    • I recommend naming this GitHub repo as shiny-00-old-faithful.

Deploying and Sharing—Step 2

  • Start a new RStudio project. In RStudio:
    1. Click New Project from the File menu
    2. Select Version Control
    3. Select Git
    4. Paste the URL to your repository in the Repository URL field
    5. Enter a Desired Project directory name (shiny-00-old-faithful)
    6. Confirm or change the subdirectory location
  • From the New File dropdown or the New File option from the File menu:
    1. Select R Script
    2. Save the blank file as app.R

Deploying and Sharing—Step 3

  • Build the application
    1. Copy and paste the code below into app.R.
    2. Preview the application: In RStudio when looking at app.R, click the Run App button at the top-right corner of the Script Pane. This previews your application locally.
    3. Add dependency file: Run rsconnect::writeManifest() in R Console.
      • This function creates manifest.json that will tell Connect Cloud (1) what version of R to use and (2) what packages and versions are required.
library(shiny)
library(viridis)
library(tidyverse)
library(hrbrthemes)
faithful <- as_tibble(datasets::faithful[, 2])

# Define UI for application that draws a histogram
ui <- fluidPage(
  
  # Application title
  titlePanel("Old Faithful Geyser Data"),
  
  # Sidebar with a slider input for number of bins 
  sidebarLayout(
    sidebarPanel(
      sliderInput(inputId = "bins",
                  label = "Number of bins:",
                  min = 1,
                  max = 60,
                  value = 30)
    ),
    
    # Show a plot of the generated distribution
    mainPanel(
      plotOutput("distPlot")
    )
  )
)

# Define server logic required to draw a histogram
server <- function(input, output) {
  
  output$distPlot <- renderPlot({
    
    v_colors <- viridis(input$bins, 
                        alpha = 1, 
                        begin = 0, 
                        end = 1, 
                        direction = 1, option = "B")
    
    ggplot(faithful, aes(x = value)) +
      geom_histogram(bins = input$bins,
                     fill = v_colors) +
      labs(x = 'Waiting time to next eruption (in mins)',
           y = "Count",
           title = 'Histogram of waiting times') +
      theme_ipsum() +
      theme(plot.title = element_text(hjust = 0.5,
                                      size = rel(1.5),
                                      face = 'bold',
                                      margin = 
                                        margin(0,0,30,0)),
            axis.title.x = element_text(size = rel(1.5),
                                        margin = 
                                          margin(30,0,0,0)),
            axis.title.y = element_text(size = rel(1.5),
                                        margin = 
                                          margin(0,30,0,0)) ,
            axis.text.x = element_text(size = rel(1.5)),
            axis.text.y = element_text(size = rel(1.5)) )
    
  })
}

# Run the application 
shinyApp(ui = ui, server = server)

Shiny applications not supported in static R Markdown documents

Deploying and Sharing—Step 4

  • Push to GitHub
    • Now that everything looks good and we have created a file to help reproduce your local environment, it is time to get the code on GitHub.
    • From the RStudio Terminal, run the following:
    git add .
    git commit -m "ANY_MESSAGE"
    git push
  • Your repository now has everything it needs for Connect Cloud.

Deploying and Sharing—Step 5

  • Deploy to Posit Connect Cloud.
    1. Sign in to Posit Connect Cloud with your GitHub account.
    2. Choose to publish from GitHub
    3. Click the Publish icon button on the top of your Portfolio page
    4. Select Shiny framework
    5. Select the public GitHub repository that you created in this tutorial
    6. Confirm the branch (main)
    7. Select app.R as the primary file
    8. Click Publish
  • Publishing will display status updates during the deployment process.
    • You will also find build logs streaming on the lower part of the screen.

Deploying and Sharing—Step 6

  • Embed the App on your personal website using Quarto Document.
---
title: "TITLE"
subtitle: "SUBTITLE"
date: 2025-05-05
---

```{=html}
<div style="text-align: center; margin: 1em 0;">
  <iframe
    src="YOUR_SHINY_APP_URL"
    style="width: 800px; height: 800px; border: none;"
  ></iframe>
</div>
```

Structure of a Shiny App

Objectives

  • Learn the required components of a Shiny app.
  • Learn how to create Shiny apps from a template.
  • Start to think in terms of inputs and outputs.
  • Practice creating apps using storm data.frame as an example.

Shiny App Components

  • Shiny apps have two main components: the ui and the server.
  • Can be in a single app.R file or in separate ui.R and server.R files.
  • The ui specifies the layout of elements on the page, including input and output elements.
  • The server does all computations, renders output and sends it to the ui.

Example: Create New Shiny App

There are two convenient ways to create a new shiny app.

  • Option 1: Create a new shiny web app from example
    • File →New File →Shiny Web App
  • Option 2: Create a new shiny app from a template
    • File→New File →R Script; start typing shinyapp and select the shinyapp {snippet}

Exercise 1: Create a Shiny App

Let’s do Shiny Exercise 1!

Example Project Data

We will be using the storms data set distributed with the dplyr package as an example.

library(shiny)
library(dplyr)
data(storms)
names(storms)

UI and Server Elements

  • The ui specifies the elements of your application and their arrangement.
    • Common elements include inputs, outputs, and descriptive text.
    • Elements can be easily arranged in panels and tabs.
  • The server is responsible for all computation and output rendering.
    • The server monitors inputs and other reactive values.
    • When inputs change, rendered outputs are created or updated.

Creating Output Elements

  • Outputs are the way generated content produced by R is displayed in shiny. Examples include:
    • textOutput()
    • plotOutput()
    • tableOutput()
  • You can use below in R Console to find other output functions in shiny.
help.search("Output", package = "shiny")

Outputs and Renderers

  • Each *Output() function has a corresponding render*() function. For example:
    • textOutput() → renderText()
    • plotOutput() → renderPlot()
    • tableOutput() → renderTable()

Exercise 2: Render Outputs

Let’s do Shiny Exercise 2!

Exercise 3: Display Number of Storms by Year

Let’s do Shiny Exercise 3!

Creating Input Elements

  • Inputs are form elements like check boxes, text fields, and sliders. Examples include:
    • textInput()
    • selectInput()
    • fileInput()
  • You can use below in R Console to find other input functions in shiny.
help.search("Input", package = "shiny")

Accessing Inputs

  • Inputs are accessed in the server function via the input argument.
  • Inputs are reactive, meaning that changes trigger updates.
  • It is often helpful to print or use str to examine inputs;
    • str(reactiveValuesToList(input)) will show the current input names and values.

Exercise 4: Create and Use Input

Let’s do Shiny Exercise 4!

Exercise 5: Display Storms for a User-Selected Year

Let’s do Shiny Exercise 5!

Interactive Tables and Graphs

Objectives

Javascript is the language of the web, and many of the most popular javascript libraries can be used directly from R.

  • Discover available html widgets that can be used in shiny applications.
  • Learn how html widgets interact with shiny.
  • Practice using html widgets as inputs and outputs in shiny apps.

Interactive Tables with DT

  • The DataTables javascript library can be used to create interactive tables directly from R. Features include:

    • Searching
    • Pagination
    • Sorting.
  • Interacting with tables updates input, enabling integration with Shiny.

  • See https://shiny.rstudio.com/articles/datatables.html for more.

Interactive Graphs with plotly

  • Plotly is a robust JavaScript data visualization library with an excellent R package. Features include:
    • Easy converson of ggplot graphs,
    • Hover, click, pan and zoom
    • Support for plots, scatter plots, error bars, box plots, heatmaps and much more.
  • Plotly includes an event_data function for retrieving values produced by interacting with the plot.
    • This enables deep integration with Shiny.
    • Let’s try plotly::plotly_example("shiny", "event_data") in R Console.

Exercise 6: HTML widgets DT and Plotly

Let’s do Shiny Exercise 6!