Lecture 1

Syllabus, Course Outline, and Introduction

Byeong-Hak Choe

SUNY Geneseo

January 22, 2025

Instructor

Instructor

Current Appointment & Education

  • Name: Byeong-Hak Choe.

  • Assistant Professor of Data Analytics and Economics, School of Business at SUNY Geneseo.

  • Ph.D. in Economics from University of Wyoming.

  • M.S. in Economics from Arizona State University.

  • M.A. in Economics from SUNY Stony Brook.

  • B.A. in Economics & B.S. in Applied Mathematics from Hanyang University at Ansan, South Korea.

    • Minor in Business Administration.
    • Concentration in Finance.

Instructor

Economics and Data Science

  • Choe, B.H., Newbold, S. and James, A., “Estimating the Value of Statistical Life through Big Data”
    • Question: How much is the society willing to pay to reduce the likelihood of fatality?
  • Choe, B.H., “Social Media Campaigns, Lobbying and Legislation: Evidence from #climatechange and Energy Lobbies.”
    • Question: To what extent do social media campaigns compete with fossil fuel lobbying on climate change legislation?
  • Choe, B.H. and Ore-Monago, T., 2024. “Governance and Climate Finance in the Developing World”
    • Question: In what ways and through what forms does poor governance act as a significant barrier to reducing greenhouse gas emissions in developing countries?

Syllabus

Syllabus

Email, Class & Office Hours

Syllabus

Course Description

  • This course delves into the tools and methodologies essential for creating visually engaging and informative data representations. Its focus is on enhancing data comprehension and facilitating effective data analytics through aesthetically pleasing graphics. The curriculum includes:

  • Key topics include:

    1. Exploring a variety of graph types, including line graphs, scatter plots, and bar charts.
    2. Preparing and organizing data from diverse sources for visualization.
    3. Tailoring graphics with a range of formats and styles, such as color schemes, fonts, and line types.
    4. Mapping geographical data effectively.
    5. Creating dynamic and interactive visualizations.
    6. Building and deploying web applications using Shiny for data visualization.
    7. Utilizing Shiny dashboard to synthesize information and narrate data stories.
  • These areas will be explored through detailed, real-world examples to address common data analysis challenges.

  • Throughout the course, practical experience is emphasized, with hands-on projects using tools like R, Python, RStudio, Quarto, Jupyter Notebook, Shiny, Git, and GitHub.

Syllabus

Required Materials

Syllabus

Reference Materials - R

Syllabus

Reference Materials - Python

Syllabus

Reference Materials - Website

Syllabus

Course Requirements

  • Laptop: You should bring your own laptop (Mac or Windows) to the classroom.

    • The minimum specification for your laptop in this course is 2+ core CPU, 4+ GB RAM, and 500+ GB disk storage.
  • Homework: There will be six homework assignments.

  • Project: There will be one project presentation and a write-up on a personal website.

  • Exams: There will be one Midterm Exam.

  • Discussions: You are encouraged to participate in GitHub-based online discussions and class discussion, and office hours.

    • Checkout the netiquette policy in the syllabus.

Syllabus

Personal Website

  • You will create your own website using Quarto, R Studio, and Git.

  • You will publish your homework assignments and team project on your website.

  • Your website will be hosted in GitHub.

  • The basics in Markdown will be discussed.

  • References:

Syllabus

Why Personal Website?

  • Here are the example websites:
  • Professional Showcase: Display skills and projects
  • Visibility and Networking: Increase online presence
  • Content Sharing and Engagement: Publish articles, insights
  • Job Opportunities: Attract potential employers and clients
  • Long-term Asset: A growing repository of your career journey

Syllabus

Team Project

  • Team formation is scheduled for late March.

    • Each team must have one to two students.
  • For the team project, a team must choose data related to business or socioeconomic issues.

  • The project report should include exploratory data analysis using summary statistics, visual representations, and data wrangling.

  • The document for the team project must be published in each member’s website.

  • The project for the team project must include a Shiny dashboard.

  • Any changes to team composition require approval from Byeong-Hak Choe.

Syllabus

Class Schedule and Exams

  • There will be tentatively 28 class sessions.

  • The Midterm Exam is scheduled on March 31, 2025, Wednesday, during the class time.

  • The Project Presentation is scheduled on May 9, 2025, Friday, 3:30 P.M.-5:30 P.M.

  • The due for the Project write-up is May 16, 2024, Friday.

Syllabus

Course Contents

  • The first half of the course covers fundamentals of data visualization:

Syllabus

Course Contents

  • The second half of the course covers advanced data visualization and Shiny apps:

Syllabus

Grading

\[ \begin{align} (\text{Total Percentage Grade}) =&\quad\;\, 0.05\times(\text{Total Attendance Score})\notag\\ &\,+\, 0.05\times(\text{Total Participation Score})\notag\\ &\,+\, 0.10\times(\text{Website Score})\notag\\ &\,+\, 0.30\times(\text{Total Homework Score})\notag\\ &\,+\, 0.50\times(\text{Total Exam and Project Score}).\notag \end{align} \]

Syllabus

Grading

  • You are allowed up to 2 absences without penalty.

    • Send me an email if you have standard excused reasons (illness, family emergency, transportation problems, etc.).
  • For each absence beyond the initial two, there will be a deduction of 1% from the Total Percentage Grade.

  • Participation will be evaluated by quantity and quality of GitHub-based online discussions and in-person discussion.

  • The single lowest homework score will be dropped when calculating the total homework score.

Syllabus

Make-up Policy

  • Make-up exams will not be given unless you have either a medically verified excuse or an absence excused by the University.

  • If you cannot take exams because of religious obligations, notify me by email at least two weeks in advance so that an alternative exam time may be set.

  • A missed exam without an excused absence earns a grade of zero.

  • Late submissions for homework assignment will be accepted with a penalty.

  • A zero will be recorded for a missed assignment.

Installing the Tools

Installing the Tools

R programming

Installing the Tools

R Studio

  • For Mac users, try the following steps:
    1. Run RStudio-*.dmg file.
    2. From the Pop-up menu, click the RStudio icon.
    3. While clicking the RStudio icon, drag it to the Applications directory.

Installing the Tools

RStudio Environment

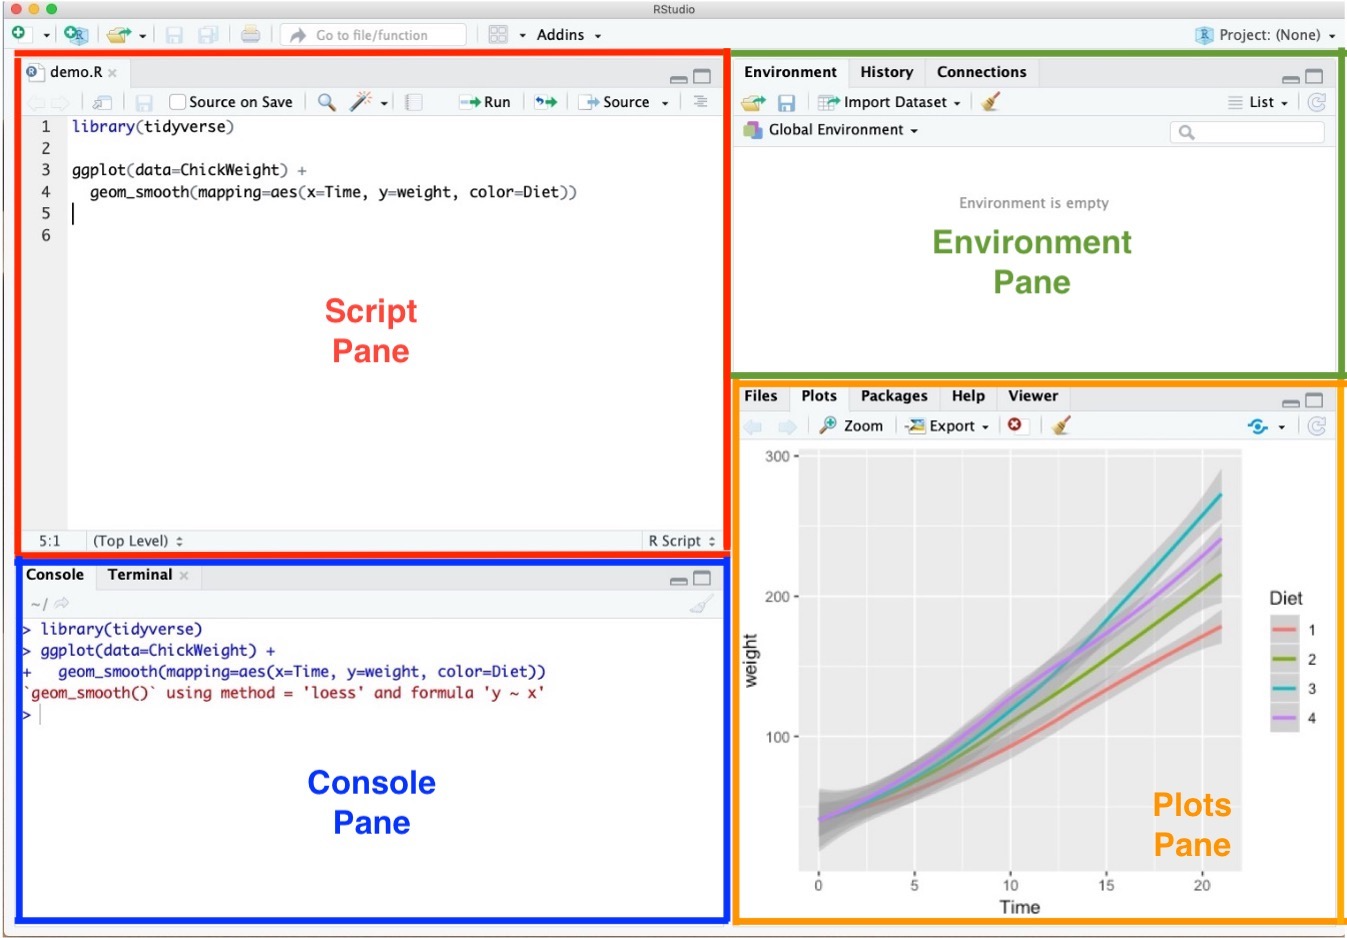
  • Script Pane is where you write R commands in a script file that you can save.

    • An R script is simply a text file containing R commands.
    • RStudio will color-code different elements of your code to make it easier to read.
  • To open an R script,
    • File \(>\) New File \(>\) R Script
  • To save the R script,
    • File \(>\) Save

Installing the Tools

RStudio Environment

  • Console Pane allows you to interact directly with the R interpreter and type commands where R will immediately execute them.

Installing the Tools

RStudio Environment

  • Environment Pane is where you can see the values of variables, data frames, and other objects that are currently stored in memory.

  • Type below in the Console Pane, and then hit Enter:

a <- 1

Installing the Tools

RStudio Environment

  • Plots Pane contains any graphics that you generate from your R code.

Installing the Tools

R Packages and tidyverse

  • R packages are collections of R functions, compiled code, and data that are combined in a structured format.

  • The tidyverse is a collection of R packages designed for data science that share an underlying design philosophy, grammar, and data structures.

    • The tidyverse packages work harmoniously together to make data manipulation, exploration, and visualization more.
    • We will use several R packages from tidyverse throughout the course. (e.g., ggplot2, dplyr, tidyr)

Installing the Tools

Installing R packages with install.packages("packageName")

  • R packages can be easily installed from within R using functions install.packages("packageName").
    • To install the R package tidyverse, type and run the following from R console:
install.packages("tidyverse")
  • While running the above codes, you may encounter the question below from the R Console:
  • Mac: “Do you want to install from sources the packages which need compilation?” from Console Pane.
  • Windows: “Would you like to use a personal library instead?” from Pop-up message.
  • Type no in the R Console, and then hit Enter.

Installing the Tools

Loading R packages with library(packageName)

  • Once installed, a package is loaded into an R session using library(packageName) so that its functions and data can be used.
    • To load the R package tidyverse, type and run the following command from a R script:
library(tidyverse)
df_mpg <- mpg
  • mpg is the data.frame provided by the R package ggplot2, one of the R pakcages in tidyverse.

Installing the Tools

RStudio Options Setting

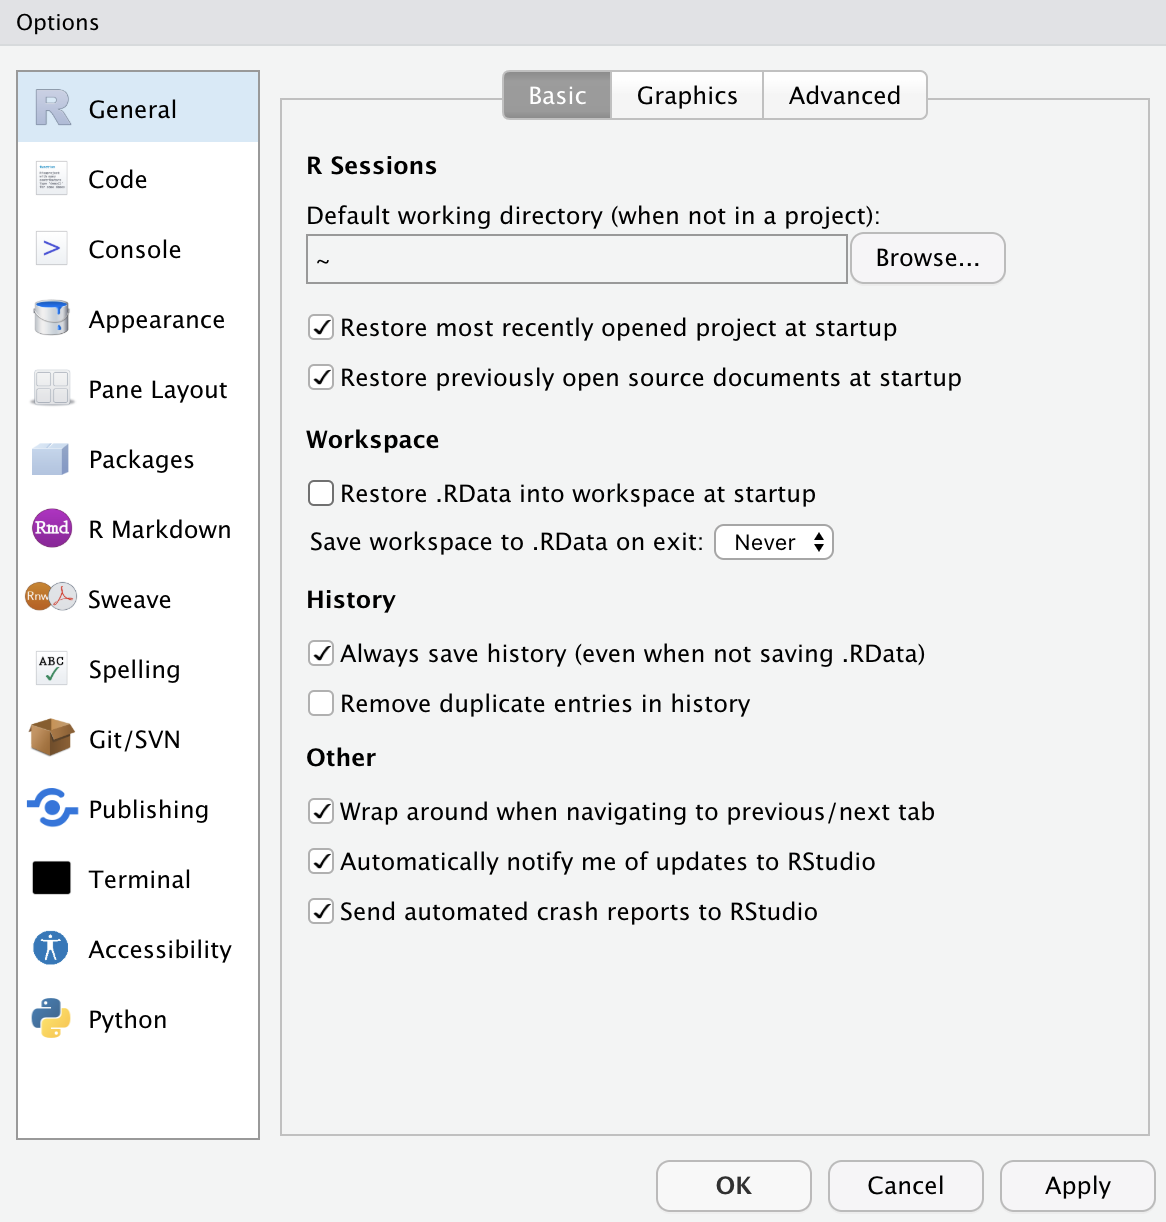
  • This option menu is found by menus as follows:
    • Tools \(>\) Global Options
  • Check the boxes as in the left.
  • Choose the option Never for Save workspace to .RData on exit:

RStudio Workflow

Shortcuts for RStudio and RScript

Mac

  • command + shift + N opens a new RScript.
  • command + return runs a current line or selected lines.
  • command + shift + C is the shortcut for # (commenting).
  • option + - is the shortcut for <-.

Windows

  • Ctrl + Shift + N opens a new RScript.
  • Ctrl + return runs a current line or selected lines.
  • Ctrl + Shift + C is the shortcut for # (commenting).
  • Alt + - is the shortcut for <-.

Workflow

Shortcuts for Lecture Slides

  • o or Esc overviews lecture slides

    • Use arrow keys to move around.
  • You can also click the menu button at the top-right corner, and go to a specific slide.

  • Ctrl + Shift + F to search.

Installing the Tools

Anaconda

Installing the Tools

Python in RStudio

::: {.panel-tabset} ## Python Option

  • We can run Python codes within RStudio.

  • Select Python interpreter in RStudio from Tools \(>\) Global Options \(>\) Python:

R package, reticulate

  • Install the R package, reticulate
install.packages("reticulate")
  • This package allows Quarto to use Python and R objects interactively within one Quarto document.