Lecture 19
Group Operations
April 30, 2025
Primer on User-Defined Functions (UDFs)
What is a User-Defined Function?
A function accepts one or more parameters and returns results.
Two key actions:
- Define the function
- Call (execute) the function
Defining a Function
- Begin with
def, add the function name, parentheses for parameters, and finish the line with a colon:.- Example: a function
my_half()that returns half of its input.
- Example: a function
- The value supplied when calling the function is an argument.
- Inside the function that value is copied to the matching parameter.
Anonymous (Lambda) Functions
- A lambda function is an anonymous one‑liner.
- Syntax:
lambda <params>: <expression>
Positional Arguments
- Positional arguments must be supplied in the order the function expects.
- Reordering them changes the meaning.
Group Operations with DataFrameGroupBy
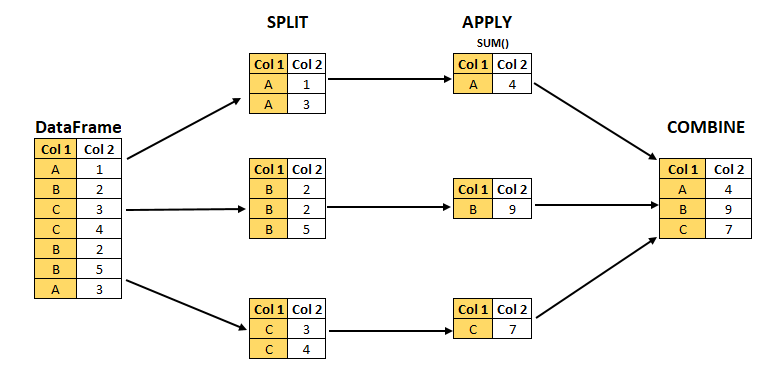
Group Operations with groupby() : Split-Apply-Combine
- The
DataFrame.groupby()method creates aDataFrameGroupByobject that facilitates split-apply-combine operations:- Split the
DataFrameinto separate groups based on unique values in one or more columns. - Apply a method or UDF independently to each group (e.g., calculate sums, averages, or custom metrics).
- Combine results into a single summarized
DataFrame.
- Split the
Fortune 1000 Dataset
- Fortune 1000 lists the 1,000 largest U.S. companies by revenue.
- Updated annually by Fortune magazine.
- The file
fortune1000_2024.csvcontains the 2024 list.
- Updated annually by Fortune magazine.
import pandas as pd
fortune1000 = pd.read_csv("https://bcdanl.github.io/data/fortune1000_2024.csv")

fortune = fortune1000[[
    "Rank", "Company", "Sector", "Industry",
    "Revenues_M", "Profits_M", "Number_of_Employees"
]]- A Sector can have many companies; an Industry is a sub‑category within a sector.
Why Group Operations?
- Suppose we want the total revenue by sector.
- Without group operations we would have to filter sector‑by‑sector:
fortune["Sector"].unique()

in_retailing =  fortune["Sector"] == "Retailing"
retail_companies = fortune[ in_retailing ]
retail_companies["Revenues_M"].sum()- Doing this for every sector is tedious —
groupby()does it for us in one line.
DataFrameGroupBy Methods and Attributes
groups— dictionary mapping each group label to the underlying row‑labels.describe()— one‑shot descriptive statistics within each group.
groupby() with agg()
Quick Aggregations
- We can invoke methods on the
DataFrameGroupByobject to apply aggregate operations to every group.- Aggregation is the process of taking multiple values and returning a single value.
fortune.groupby("Sector").size()
fortune.groupby("Sector").mean()
fortune.groupby("Sector").median()
fortune.groupby("Sector").max()
fortune.groupby("Sector").min()
fortune.groupby("Sector").sum()- The
size()method on theDataFrameGroupByobject returns aSerieswith an alphabetical list of the groups and their observation counts.
Column‑wise Aggregations
fortune.groupby("Sector")["Revenues_M"].mean()
fortune.groupby("Sector")["Revenues_M"].median()
fortune.groupby("Sector")["Revenues_M"].max()
fortune.groupby("Sector")["Revenues_M"].min()
fortune.groupby("Sector")["Revenues_M"].sum()- We can target a single variable by passing its name inside square brackets after the
DataFrameGroupByobject.- Pandas returns a new object, a
SeriesGroupBy.
- Pandas returns a new object, a
The agg() Method
fortune.groupby("Sector")["Revenues_M"]  # this is a SeriesGroupBy object
fortune.groupby("Sector")["Revenues_M"].agg('sum')
fortune.groupby("Sector")["Revenues_M"].agg('mean')
fortune.groupby("Sector")["Revenues_M"].agg('max')
fortune.groupby("Sector")["Revenues_M"].agg('min')- The
agg()method can also be used on aSeriesGroupBy. - Instead of directly calling the aggregation method, we can call the
agg()method, and pass the aggregation method we want in there.
Aggregation
fortune.groupby("Sector").agg(
  Revenues_M_min = ("Revenues_M", "min"),
  Profits_M_max = ("Profits_M", "max"),
  Number_of_Employees_mean = ("Number_of_Employees", "mean")
)- The
agg()method can apply multiple aggregate operations to different variables and can accept a tuple as its argument.DataFrameGroupBy.agg(VARIABLE_NAME_1 = ("VARIABLE_1", "STATISTICS"), )
Useful Built-in Functions
| Aggregation | Description |
|---|---|
size() |
Number of observations in each group |
count() |
Number of non-missing values in each group |
nunique() |
Number of unique/distinct values in each group |
value_counts() |
Count of unique values for a variable within each group |
mean(), median() |
Mean and median values |
min(), max() |
Minimum and maximum values |
std() |
Standard deviation |
sum() |
Sum of all values |
- We pass in whatever aggregation we want.
agg() with a lambda UDF
- Some built‑in function cannot be directly passed to
agg(). - We can then supply a
lambdafunction that receives a Series and returns a single value:
fortune.groupby("Sector").agg(
    Revenue_IQR = ("Revenues_M", lambda s: s.quantile(0.75) - s.quantile(0.25) )
)- Any one‑line function can be supplied inline as
lambda s: …. - The function must return one value per group.
agg() with a Named UDF
- We can also define a named UDF once and then reference it in your
agg()call:
Group Operations
Let’s do Questions 1-3 in Classwork 13!
groupby() with transform()
transform() – Return to Original Shape
- Just like the
agg()method, thetransform()method can accept the built-in functions (e.g.,'sum','mean').
- Unlike the
agg()method, thetransform()method does not collapseDataFrameand goes back to the original index.
transform() with a lambda UDF
fortune["Rev_centered"] = (
    fortune.groupby("Sector")["Revenues_M"]
           .transform(lambda s: s - s.mean())
)- Each group’s mean is subtracted from its members, yielding a de‑meaned revenue variable.
transform() with a Named UDF
- Rather than an inline
lambda, we can also define a named UDF and pass it to.transform():
DataFrame.assign() and DataFrameGroupBy.transform()
sectors = fortune.groupby("Sector")

fortune_new = fortune.assign(
    Year = 2024,
    nCompanies = sectors.transform('size'),
    Revenues_M_min = sectors['Revenues_M'].transform('min'),
    Profits_M_max = sectors['Profits_M'].transform('max'),
    Number_of_Employees_mean = sectors['Number_of_Employees'].transform('mean')
)assign()can be used to add a new variable to aDataFrame.assign()is aDataFramemethod, not aDataFrameGroupBymethod.
transform() with shift()
f_2021_2024is a long-from DataFrame, containing 741 companies that appeared in the Fortune 1000 list consecutively from 2021 to 2024.
- Here we are interested in calculating the yearly revenue growth rate for each company in
fortune_2021_2024using the following formula: \[ \text{(Revenue Growth Rate)}_{year} = \frac{\text{Revenue}_{year} - \text{Revenue}_{year-1}}{\text{Revenue}_{year-1}} \]
- What
shift()does in pandas:shift()moves values up or down along the index (rows).- It shifts the data by a number of periods (default is 1 period down).
- It is often used to compare a row with a previous (or future) row.
shift(1): shift down (default)shift(-1): shift up
f_2021_2024['GrowthRate_Revenue'] = (
    (f_2021_2024['Revenues_M'] - f_2021_2024['Revenues_M_last_year']) /
          f_2021_2024['Revenues_M_last_year']
)
\[ \text{(Revenue Growth Rate)}_{year} = \frac{\text{Revenue}_{year} - \text{Revenue}_{year-1}}{\text{Revenue}_{year-1}} \]
- Using the historical daily stock data, we can calculate each company’s daily percentage change in stock price.
Group Operations
Let’s do Question 4 in Classwork 13!
groupby() with apply()
Applying a UDF to All Groups
- Sometimes we need something neither
agg()nortransform()can do, like “top‑3 by revenue in each sector”.- Use
apply()and provide a method that operates on each group’sDataFrame.
- Use
fortune_shuffled = pd.read_csv("https://bcdanl.github.io/data/fortune1000_2024_shuffled.csv")
sectors = fortune_shuffled.groupby("Sector")- How can we get a DataFrame with top 5 companies in each sector?
sort_values()withgroupby()nlargest()withgroupby()
- However,
DataFrameGroupByhas no methodssort_values()ornlargest().
Applying a lambda UDF with .apply()
- We can directly apply a custom function (UDF) using a lambda expression with
.apply():
This returns the largest observation(s) within each group.
When we use
DataFrame.groupby().apply(), pandas returns a MultiIndex where the first level is the group label and the second level is the original row index.
Passing Additional Parameters
- How can we apply a UDF with multiple parameters to
DataFrameGroupByobject?
def get_nlargest_obs(df, n, var):
  return df.nlargest(n, var, keep = "all")

sectors.apply(get_nlargest_obs, 2, "Revenues_M")- When applying a UDF with multiple parameters to
DataFrameGroupByobject, we need to provide the rest of arguments to theapply()method.
Passing Additional Parameters
- Suppose we want to filter groups based on a threshold for a given variable:
def filter_by_threshold(df, column, threshold):
    return df[ df[column] > threshold ]

sectors.apply(filter_by_threshold, "Revenues_M", 5000)- In this example, the arguments
"Revenues_M"and5000are passed to filter rows within each group.
Applying a UDF to All Groups
- Can we apply a lambda function with multiple parameters to
DataFrameGroupByobject?
- Lambda functions do not support passing additional parameters directly in the
apply()method!- We would typically need to provide arguments to additional parameters within the lambda function.
agg() vs. transform() vs. apply()
- Use
agg()with.groupby()when summarizing multiple values into a single aggregated value per group.- Groups become the new index labels.
- Use
transform()with.groupby()when computing one aggregated value per observation.- Does not collapse the
DataFrame.
- Does not collapse the
fortune["Revenue_diff_mean"] = fortune["Revenues_M"] - fortune.groupby("Sector")["Revenues_M"].transform("mean")- Use
apply()with.groupby()for custom operations returning multiple observations per group.
agg() vs. transform() vs apply()
| Method | Purpose | Result Shape | Example Use Case |
|---|---|---|---|
agg() |
Summarize groups | One row per group | Calculate average revenue by sector |
transform() |
Broadcast group-level metrics | Same shape as original DataFrame |
Add a column that repeats each sector’s average revenue for every row |
apply() |
Complex processing | Varies with function | Get top N companies in each sector |
Group Operations
Let’s do Questions 5-6 in Classwork 13!
Grouping by Multiple Variables
Grouping by Multiple Variables
sector_and_industry = fortune.groupby(["Sector", "Industry"])

sector_and_industry.groups
len(sector_and_industry)
sector_and_industry.describe()- We can create
DataFrameGroupByobject with values from multiple variables.- This operation is optimal when a combination of variables serves as the best identifier for a group.
- Grouping on two or more columns gives us a MultiIndex whose levels correspond exactly to those grouping columns.
Aggregation with agg()
Adding New Variables with transform()
Custom group logic with apply()
Course Summary
What We Learned This Semester
- Tools & Environments
- Used Quarto/Jupyter Notebooks to communicate data analysis through your personal website managed with git and GitHub
- Data Manipulation & Cleaning
- Transformed, reshaped, merged, summarized datasets
- Applied
pandasfor efficient and scalable data wrangling
- Data Collection
- Collected data through web scraping with
selenium - Retrieved structured data from APIs using
requests
- Collected data through web scraping with
- Stock and ESG Data Project
- Collect, clean, visualize, and analyze stock and ESG data
- Present your analysis through a fully published project webpage
Student Course Evaluation (SCE)
- I have tried to improve your learning experience in this course.
- I value your feedback immensely.
- I request for your participation in the Student Course Evaluation (SCE).
- Take 10 minutes right now to complete the SCE.
- On your laptop, access the SCE form for DANL 210 as follows:
- Log in to Knightweb
- Click on the “Surveys” option
- Choose DANL 210 and then complete the SCE survey.
Group Operations
Let’s do Classwork 14!