Lecture 11
Pandas Fundamentals VI: Group Operations
April 27, 2026
🧩 Primer on User-Defined Functions (UDFs)
🧠 What Is a User-Defined Function?
A function accepts one or more parameters and returns results.
Two key actions:
- Define the function
- Call (execute) the function
✍️ Defining a Function
- Begin with
def, add the function name, parentheses for parameters, and finish the line with a colon:.- Example: a function
my_half()that returns half of its input.
- Example: a function
- The value supplied when calling the function is an argument.
- Inside the function that value is copied to the matching parameter.
⚡ Lambda Functions
- A lambda function is an anonymous one‑liner.
- Syntax:
lambda <params>: <expression>
📍 Positional Arguments
- Positional arguments must be supplied in the order the function expects.
- Reordering them changes the meaning.
🧮 Group Operations with groupby()
🔀 Split-Apply-Combine
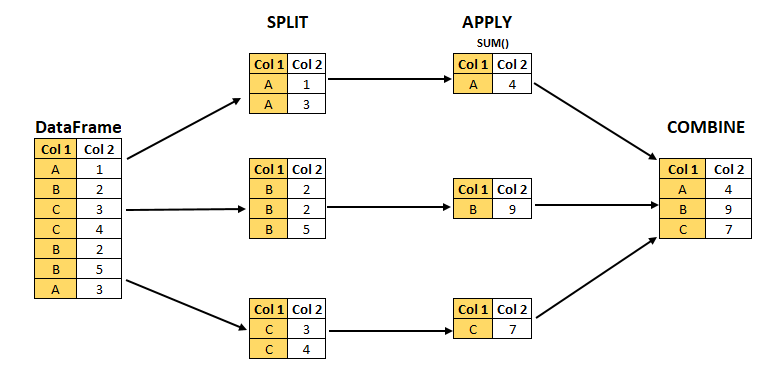
- The
DataFrame.groupby()method creates aDataFrameGroupByobject that facilitates split-apply-combine operations:- Split the
DataFrameinto separate groups based on unique values in one or more columns. - Apply a method or UDF independently to each group (e.g., calculate sums, averages, or custom metrics).
- Combine results into a single summarized
DataFrame.
- Split the
🏢 Fortune 1000 Dataset
- Fortune 1000 lists the 1,000 largest U.S. companies by revenue.
- Updated annually by Fortune magazine.
- The file
fortune1000_2025.csvcontains the 2025 list.
- Updated annually by Fortune magazine.
import pandas as pd
import numpy as np

# Below is for an interactive display of DataFrame in Colab
from google.colab import data_table
data_table.enable_dataframe_formatter()

fortune1000 = pd.read_csv("https://bcdanl.github.io/data/fortune1000_2025.csv")
fortune = fortune1000[[
    "Rank", "Company", "Sector", "Industry",
    "Revenues_M", "Profits_M", "Number_of_Employees"
]]- A Sector can have many companies; an Industry is a sub‑category within a sector.
❓ Why Use groupby()?
- Suppose we want the total revenue by sector.
- Without group operations we would have to filter sector‑by‑sector:
fortune["Sector"].unique()

in_retailing =  fortune["Sector"] == "Retailing"
retail_companies = fortune[ in_retailing ]
retail_companies["Revenues_M"].sum()- Doing this for every sector is tedious —
groupby()does it for us in one line.
🧱 Creating a DataFrameGroupBy Object
groups— dictionary mapping each group label to the underlying row‑labels.describe()— one‑shot descriptive statistics within each group.
📊 Summarizing Groups with agg()
🎯 Selecting One Column
fortune.groupby("Sector")["Revenues_M"].mean()
fortune.groupby("Sector")["Revenues_M"].median()
fortune.groupby("Sector")["Revenues_M"].max()
fortune.groupby("Sector")["Revenues_M"].min()
fortune.groupby("Sector")["Revenues_M"].sum()- We can target a single variable by passing its name inside square brackets after the
DataFrameGroupByobject.- Pandas returns a new object, a
SeriesGroupBy.
- Pandas returns a new object, a
- Aggregation is the process of taking many values and returning a single value, here one number per sector.
🔢 Quick Group Summaries
size()returns aSerieswith an alphabetical list of groups and their observation counts, the number of rows in each sector.- It is usually the first thing to check after a
groupby(): how many companies fall into each group?
- It is usually the first thing to check after a
size()counts every row in the group.count()counts only non-missing values, so it can differ column by column whenNaNs are present.
⚙️ The agg() Method
fortune.groupby("Sector")["Revenues_M"]  # this is a SeriesGroupBy object
fortune.groupby("Sector")["Revenues_M"].agg('sum')
fortune.groupby("Sector")["Revenues_M"].agg('mean')
fortune.groupby("Sector")["Revenues_M"].agg('max')
fortune.groupby("Sector")["Revenues_M"].agg('min')- The
agg()method can also be used on aSeriesGroupBy. - Instead of directly calling the aggregation method, we can call the
agg()method, and pass the aggregation method we want in there. - So far,
.agg('sum')just duplicates.sum(). So is.agg()actually worth learning?
🧾 Multiple Summaries with agg()
fortune.groupby("Sector").agg(
  Revenues_M_min = ("Revenues_M", "min"),
  Profits_M_max = ("Profits_M", "max"),
  Number_of_Employees_mean = ("Number_of_Employees", "mean")
)- The
agg()method can apply multiple aggregate operations to different variables and can accept a tuple as its argument.DataFrameGroupBy.agg(VARIABLE_NAME_1 = ("VARIABLE_1", "STATISTICS"), )
- This is where
.agg()pays off: one call, different statistics on different columns, and we name each output column ourselves.
🧰 Common Aggregation Functions
| Aggregation | Description |
|---|---|
size() |
Number of observations in each group |
count() |
Number of non-missing values in each group |
nunique() |
Number of unique/distinct values in each group |
value_counts() |
Counts of each unique value for a variable within each group |
mean(), median() |
Mean and median values |
min(), max() |
Minimum and maximum values |
std() |
Standard deviation |
sum() |
Sum of all values |
- We pass in whatever aggregation we want.
📏 Custom Summary with a Lambda UDF
- Some built‑in function cannot be directly passed to
agg(). - We can then supply a
lambdafunction that receives a Series and returns a single value:
fortune.groupby("Sector").agg(
    Revenue_IQR = ("Revenues_M", lambda s: s.quantile(0.75) - s.quantile(0.25) )
)- Any one‑line function can be supplied inline as
lambda s: …. - The function must return one value per group.
🏷️ Custom Summary with a Named UDF
- We can also define a named UDF once and then reference it in your
agg()call:
🧩 Adding Group-Based Columns with transform()
🔁 transform() – Return to Original Shape
- Just like the
agg()method, thetransform()method can accept the built-in functions (e.g.,'sum','mean').
- Unlike the
agg()method, thetransform()method does not collapseDataFrameand goes back to the original index.
📌 Centering Within Groups
fortune["Rev_centered"] = (
    fortune.groupby("Sector")["Revenues_M"]
           .transform(lambda s: s - s.mean())
)- Each group’s mean is subtracted from its members, yielding a de‑meaned revenue variable.
🧪 transform() with a Custom Function
- Rather than an inline
lambda, we can also define a named UDF and pass it to.transform():
🧷 Adding Several Group-Based Columns with DataFrame.assign() and DataFrameGroupBy.transform()
sectors = fortune.groupby("Sector")

fortune_new = fortune.assign(
    Year = 2025,
    nCompanies = sectors.transform('size'),
    Revenues_M_min = sectors['Revenues_M'].transform('min'),
    Profits_M_max = sectors['Profits_M'].transform('max'),
    Number_of_Employees_mean = sectors['Number_of_Employees'].transform('mean')
)assign()can be used to add a new variable to aDataFrame.assign()is aDataFramemethod, not aDataFrameGroupBymethod.
📈 Grouped shift() for Time Comparisons
📋 Data
f_2021_2025is a long-form DataFrame, containing 705 companies that appeared in the Fortune 1000 list consecutively from 2021 to 2025.
The data are sorted by
Rank_mean(ascending), then byyear(descending).Here we are interested in calculating the yearly revenue growth rate for each company in
fortune_2021_2025using the following formula: \[ \text{(Revenue Growth Rate)}_{year} = \frac{\text{Revenue}_{year} - \text{Revenue}_{year-1}}{\text{Revenue}_{year-1}} \]
📈 Grouped shift() for Time Comparisons
⏭️ shift()
- What
shift()does in pandas:shift()moves values up or down along the index (rows).- It shifts the data by a number of periods (default is 1 period down).
- It is often used to compare a row with a previous (or future) row.
shift(1): shift down (default)shift(-1): shift up
📈 Grouped shift() for Time Comparisons
📉 Percentage Changes
f_2021_2025['GrowthRate_Revenue'] = (
    (f_2021_2025['Revenues_M'] - f_2021_2025['Revenues_M_last_year']) /
          f_2021_2025['Revenues_M_last_year']
)
\[ \text{(Revenue Growth Rate)}_{year} = \frac{\text{Revenue}_{year} - \text{Revenue}_{year-1}}{\text{Revenue}_{year-1}} \]
- Using the historical daily stock data, we can calculate each company’s daily percentage change in stock price.
🛠️ Flexible Group Logic with apply()
🧩 What apply() Does
- Sometimes we need something neither
agg()nortransform()can do, like “top‑3 by revenue in each sector”.- Use
apply()and provide a method that operates on each group’sDataFrame.
- Use
url_path = "https://bcdanl.github.io/data/fortune1000_2025_shuffled.csv"
fortune_shuffled = pd.read_csv(url_path)
sectors = fortune_shuffled.groupby("Sector")- How can we get a DataFrame with top 5 companies in each sector?
sort_values()withgroupby()nlargest()withgroupby()
- However,
DataFrameGroupByhas no methodssort_values()ornlargest().
🏆 Top Company in Each Sector
- We can directly apply a custom function (UDF) using a lambda expression with
.apply():
This returns the largest observation(s) within each group.
When we use
DataFrame.groupby().apply(), pandas returns a MultiIndex where the first level is the group label and the second level is the original row index.
🔝 Top N Companies in Each Sector
- How can we apply a UDF with multiple parameters to
DataFrameGroupByobject?
def get_nlargest_obs(df, n, var):
  return df.nlargest(n, var, keep = "all")

sectors.apply(get_nlargest_obs, 2, "Revenues_M")- When applying a UDF with multiple parameters to
DataFrameGroupByobject, we need to provide the rest of arguments to theapply()method.
🚦 Filtering Within Each Group
- Suppose we want to filter groups based on a threshold for a given variable:
def filter_by_threshold(df, column, threshold):
    return df[ df[column] > threshold ]

sectors.apply(filter_by_threshold, "Revenues_M", 5000)- In this example, the arguments
"Revenues_M"and5000are passed to filter rows within each group.
🌐 Applying a UDF to All Groups
- Can we apply a lambda function with multiple parameters to
DataFrameGroupByobject?
- Lambda functions do not support passing additional parameters directly in the
apply()method!- We would typically need to provide arguments to additional parameters within the lambda function.
🧭 Choosing Between agg(), transform(), and apply()
🧠 Decision Rule
| Method | Use When… | Result Shape | Example |
|---|---|---|---|
agg() |
You want one summary row per group | One row per group | Average revenue by sector |
transform() |
You want a group statistic added to each original row | Same number of rows as original data | Sector average revenue for each company |
apply() |
You need flexible custom logic | Depends on the function | Top 3 companies in each sector |
✅ Side-by-Side Examples
# One row per sector
fortune.groupby("Sector").agg(
    avg_revenue = ("Revenues_M", "mean")
)

# One value per original row
fortune["sector_avg_revenue"] = (
    fortune.groupby("Sector")["Revenues_M"].transform("mean")
)

# Flexible output
fortune.groupby("Sector").apply(
    lambda df: df.nlargest(3, "Revenues_M", keep="all")
)
🚀 Classwork 17: Pandas Fundamentals
Let’s do Classwork 17!
🧱 Grouping by Multiple Variables
🏷️ Grouping by Sector and Industry
sector_and_industry = fortune.groupby(["Sector", "Industry"])

sector_and_industry.groups
len(sector_and_industry)
sector_and_industry.describe()- We can create
DataFrameGroupByobject with values from multiple variables.- This operation is optimal when a combination of variables serves as the best identifier for a group.
- Grouping on two or more columns gives us a MultiIndex whose levels correspond exactly to those grouping columns.
📊 Summaries with Multiple Grouping Variables
🧮 Percent of Industry Revenue
🔍 Custom Logic with Multiple Groups
🚀 Classwork 18: Pandas Fundamentals
Let’s do Classwork 18!
✅ Course Reflection & Wrap-Up
📘 What We Learned This Semester
- 💻 Python Fundamentals
- Variables, conditionals, loops, and data structures
- 🌐 Data Collection
- Selenium web scraping and APIs
- 📊 Data Analysis with Pandas
- Data cleaning, transformation, and grouping
- 🧩 Data Analytics Project
- Applying the full workflow from data collection to analysis and presentation
- Finding patterns and communicating insights with data
📝 Student Course Experience (SCE) Survey
Your Feedback Matters
I have made every effort to create a meaningful and supportive learning experience in this course.
Your feedback is extremely valuable and helps improve future versions of the course.
I sincerely encourage you to complete the Student Course Experience (SCE) survey.
✅ Please Take About 10 Minutes Now
Direct SCE Link
🔗 https://go.geneseo.edu/scesurveys
Steps
- Log in to the SCE Survey Portal
- Click on “Surveys”
- Select DANL 210: Data Preparation and Management
- Complete the evaluation survey
🙌 Thank You
Thank you for being part of DANL 210 this semester.
I really appreciate the effort you put into learning Python, working with data, and building new skills.
I hope Python feels a little less intimidating than it did in January, and I hope this course gave you more confidence in handling real-world data in the future.
Thank you again for your participation, feedback, and hard work throughout the semester. It has been a pleasure.
— Byeong-Hak