Lecture 6
Pandas Fundamentals I: Loading, Summarizing, and Counting Data
March 23, 2026
✅ Learning Objectives
Learning Objectives
- Loading
DataFramewithread_csv() - Getting a Summary with
info()anddescribe() - Mathematical & Vectorized Operations
- Adding, Removing, and Renaming Variables
- Selecting and Relocating Variables with
[] - Counting Values with
value_counts(),nunique(), andcount() - Sorting with
sort_values()andsort_index() - Indexing with
set_index()andreset_index() - Locating Observations and Values with
loc[]andiloc[] - Converting Data Types with
.astype() - Filtering Observations
Learning Objectives
- Dealing with Missing Values
- Dealing wit Duplicates
- Reshaping
DataFrameswith.melt()and.pivot() - Joining
DataFrameswith.merge()
🐼 Pandas Series and DataFrame
Pandas Series and DataFrame
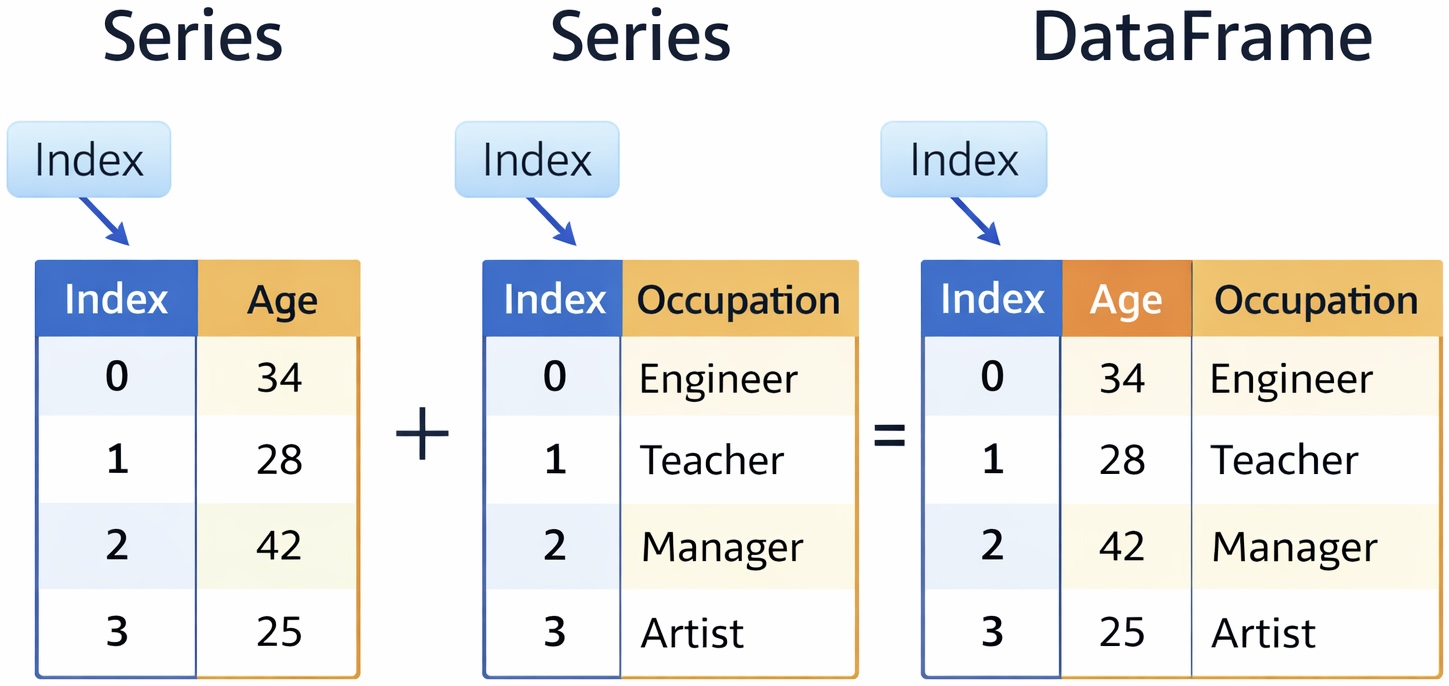
Series: A one-dimensional object containing a sequence of values (like a list).DataFrame: A two-dimensional table made of multipleSeriescolumns sharing a common index.
🧐 Observations in DataFrame
- Rows in a
DataFramerepresent individual units or entities for which data is collected.
- Examples:
- Student Information: Each row = one student
- Employee Information: Each row = one employee
- Daily S&P 500 Index Data: Each row = one trading day
- Household Survey Data: Each row = one household
- Student Information: Each row = one student
🏷️ Variables in DataFrame
- Columns in a
DataFramerepresent attributes or characteristics measured across multiple observations.
- Examples:
- Student Data:
Name,Age,Grade,Major
- Employee Data:
EmployeeID,Name,Age,Department
- Customer Data:
CustomerID,Name,Age,Income,HousingType
- Student Data:
Note
- In a
DataFrame, a variable is a column of data.
- In general programming, a variable is the name of an object.
✨ Tidy DataFrame
Variables, Observations, and Values
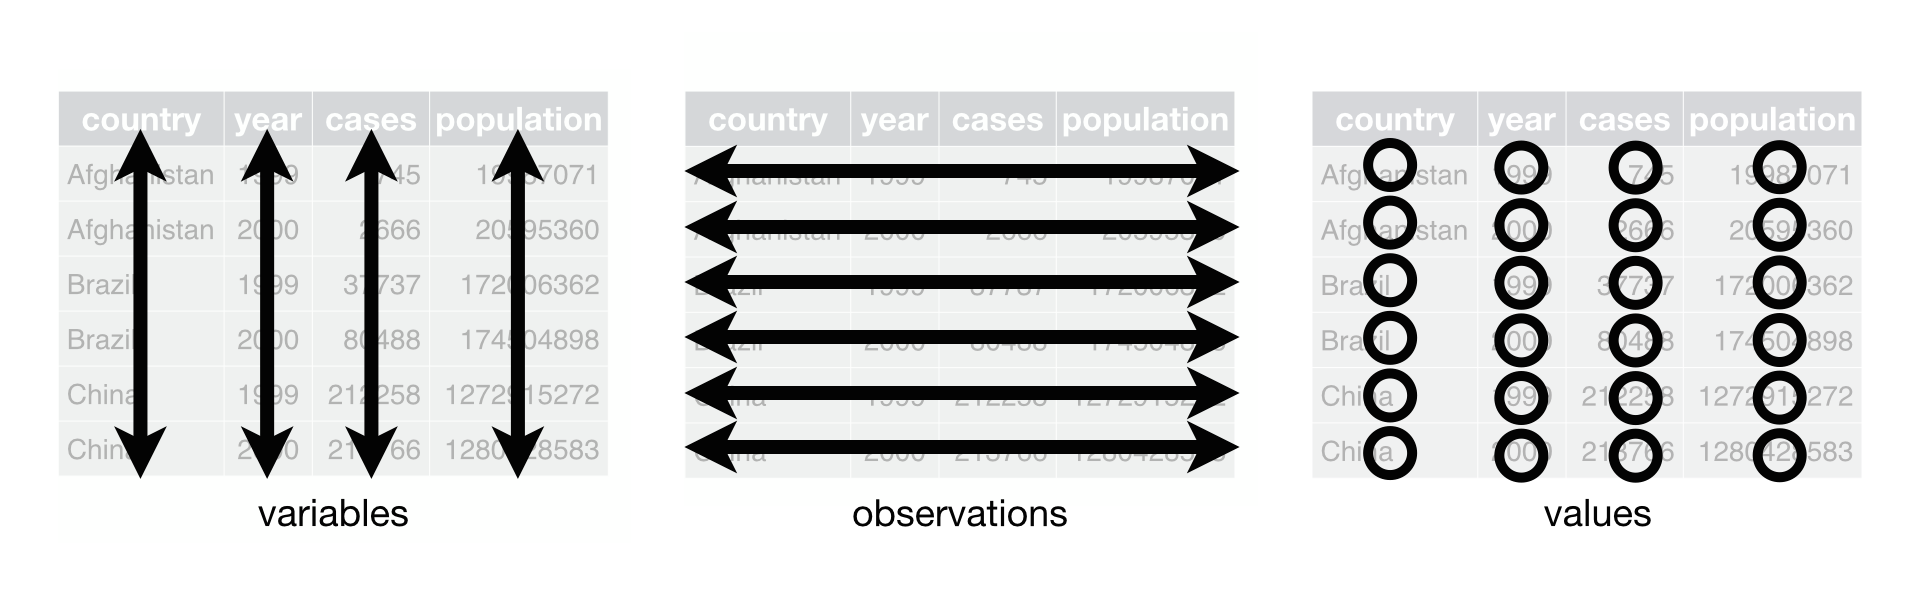
A
DataFrameis tidy if it follows three rules:- Each variable has its own column.
- Each observation has its own row.
- Each value has its own cell.
- Each variable has its own column.
A tidy
DataFramekeeps your data organized, making it easier to understand, analyze, and share in any data analysis.
📥 Loading Data
Importing a data set with read_csv()
A CSV (comma-separated values) is a plain-text file that uses a comma to separate values (e.g., nba.csv).
The CSV is widely used for storing data, and we will use this throughout the module.
We use the
read_csv()function to load a CSV data file.
read_csv() with parse_dates
- We can use the
parse_datesparameter to coerce the values intodatetimes.
Mounting Google Drive on Google Colab
drive.mount('/content/drive')- To mount your Google Drive on Google colab:
files.upload()- To initiate uploading a file on Google Drive:
- To find a pathname of a CSV file in Google Drive:
- Click 📁 from the sidebar menu
drive➡️MyDrive…- Hover a mouse cursor on the CSV file
- Click the vertical dots
- Click “Copy path”
Colab’s Interactive DataFrame Display
from google.colab import data_table
data_table.enable_dataframe_formatter()  # Enabling an interactive DataFrame display

nba- Colab includes an extension that renders pandas
DataFramesinto interactive displays.
nba DataFrame
- Let’s read the nba.csv file as
nba:
# Below is to import the pandas library as pd
import pandas as pd

# Below is to import the numpy library as np
import numpy as np

# Below is for an interactive display of DataFrame in Colab
from google.colab import data_table
data_table.enable_dataframe_formatter()

# Below is to read nba.csv as nba DataFrame
nba = pd.read_csv("https://bcdanl.github.io/data/nba.csv",
                  parse_dates = ["Birthday"])
📋 Getting a Summary of Data
⚙️ Dot Operators, Methods, and Attributes
⚫ Dot operator
- The dot operator (
DataFrame.) is used for an attribute or a method on objects.
🛠️ Method
- A method (
DataFrame.METHOD()) is a function that we can call on aDataFrameto perform operations, modify data, or derive insights.- e.g.,
df.info()
- e.g.,
🏷️ Attribute
- An attribute (
DataFrame.ATTRIBUTE) is a property that provides information about theDataFrame’s structure or content without modifying it.- e.g.,
df.columns
- e.g.,
📑 Getting a Summary of a DataFrame
- Every
DataFrameobject has a.info()method that provides a summary of a DataFrame:- Variable names (
.columns) - Number of observations and variables (
.shape) - Number of non-missing values in each variable (
.count())- Pandas often displays missing values as
NaN.
- Pandas often displays missing values as
- Variable names (
Getting a Descriptive Statistics of a DataFrame with .describe()
.describe()method generates descriptive statistics that summarize the central tendency, dispersion, and distribution of each variable.- It can also process
string-type variables if specified explicitly (include='all').
- It can also process
⚙️ Mathematical & Vectorized Operations
Mathematical Operations
- The
max()method returns aSerieswith the maximum value from each variable. - The
min()method returns aSerieswith the minimum value from each variable.
Mathematical Operations
- The
sum()/mean()/median()method returns aSerieswith the sum/mean/median of the values in each variable. - The
quantile()method returns aSerieswith the percentile value of the values in each variable (e.g., 25th, 75th, 90th percentile). - The
std()method returns aSerieswith the standard deviation of the values in each variable. - To limit the operation to numeric volumes, we can pass
Trueto thesum()/mean()/median()/std()method’snumeric_onlyparameter.
Vectorized Operations
nba["Salary"] + nba["Salary"]
nba["Name"] + " (" + nba["Position"] + ")"
nba["Salary"] - nba["Salary"].mean()pandasperforms a vectorized operation onSeriesor a variable inDataFrame.- This means an element-by-element operation.
- This enables us to apply functions and perform operations on the data efficiently, without the need for explicit loops.
✏️️ Adding, Removing, and Renaming Variables
Adding and Removing Variables
Removing Variables with drop(columns = ...)
Renaming Variables with nba.columns
Renaming Variables with rename( columns = { "Existing One" : "New One" } )
- The above
rename()method renames the variable Date of Birth to Birthday.
🛠️ Selecting, Relocating, Adding, Removing, and Renaming Variables
Selecting a Variable by its Name
- If we want only a specific variable from a
DataFrame, we can access the variable with its name using squared brackets,[ ].DataFrame[ 'var_1' ]DataFrame[ ['var_1'] ]
Selecting & Relocating Multiple Variables by their Names
- In order to specify multiple variables by their names, we need to pass in a Python list between the square brackets.
DataFrame[ ['var_1', 'var_2', ... ] ]- This is also how we can relocate variables by the order specified in the list.
🔢 Counting Methods
Counting with .count()
- The
Series.count()counts the number of non-missing values in a single value. - The
DataFrame.count()counts the number of non-missing values in aSeries.
Counting with .nunique()
- The
Series.nunique()counts the number of unique values in a single value integer. - The
DataFrame.nunique()counts the number of unique values in each variable in aDataFrame, returning aSeries.
Counting with .value_counts()
- The
.value_counts()counts the number of occurrences of each unique value in aSeries.
A Quick Comparison
| Function | What it does |
|---|---|
.count() |
Counts non-missing values |
.nunique() |
Counts distinct values |
.value_counts() |
Counts frequencies of unique values |
🚀 Classwork 10: Pandas Fundamentals
Let’s do Classwork 10!