Lecture 6
pandas Basics - Loading Data
February 10, 2025
Workflow for File Management
Workflow for File Management
- Save your Jupyter Notebook for each class to a dedicated directory in your local laptop, Google Drive, or a new GitHub repo.
- Go to File and select Save …/ ( e.g.,
danl-210-lec-08-2025-0210.ipynb)
- Go to File and select Save …/ ( e.g.,
Workflow for File Management
Your Personal Website
- In your local website project directory, avoid having
- Any file that exceeds 30 MB in size;
.ipynbfiles you do not use for your website.
- Your website project directory should include files specifically dedicated to your website.
Workflow for File Management
Jupyter Notebooks for Your Webpage
- Run Python code cells in a Jupyter Notebook (
.ipynb) on Google Colab. Then, download the Jupyter Notebook from Google Colab. - Use the Finder/File Explorer to move the Jupyter Notebook file (
.ipynb) to your website project directory. (If it is for a blog post, create a subdirectory in thepostsdirectory, and move it to the subdirectory.) - Edit
_quarto.ymlproperly. Save the changes by clicking the floppy disk icon (💾). - On Terminal, run
quarto render. - Once
quarto rendercompletes, view theindex.htmlin your website working directory to see the HTML output. - After confirming the HTML output, use the 3-step
gitcommands (add-commit-push) on Terminal to update your online website.
Pandas Basics and Remaining Course Contents
Pandas Basics
Learning Objectives
- Loading
DataFramewithread_csv() - Getting a Summary with
info()anddescribe() - Selecting and Relocating Variables with
[] - Counting Values with
value_counts(),nunique(), andcount() - Sorting with
sort_values()andsort_index() - Indexing with
set_index()andreset_index() - Locating Observations and Values with
loc[]andiloc[] - Mathematical & Vectorized Operations
- Adding, Removing, and Renaming Variables
- Converting Data Types with
.astype() - Filtering Observations
Pandas Basics
Learning Objectives
- Dealing with Missing Values
- Dealing wit Duplicates
- Reshaping
DataFrameswith.melt()and.pivot() - Joining
DataFrameswith.merge() - Concatenating
DataFrames
Data Collection
Learning Objectives
- Scrapping web tables with
.read_html() - Scrapping web data with
selenium - Collecting web data with Application Programming Interfaces (APIs)
Pandas Group Operations & Data Visualization
Learning Objectives
- Using Custom Functions and Anonymous Functions
- Grouping
DataFrameswithgroupby(),.agg(), and.transform() - Visualizing
DataFrameswithseaborn
Loading Data
Series and DataFrame

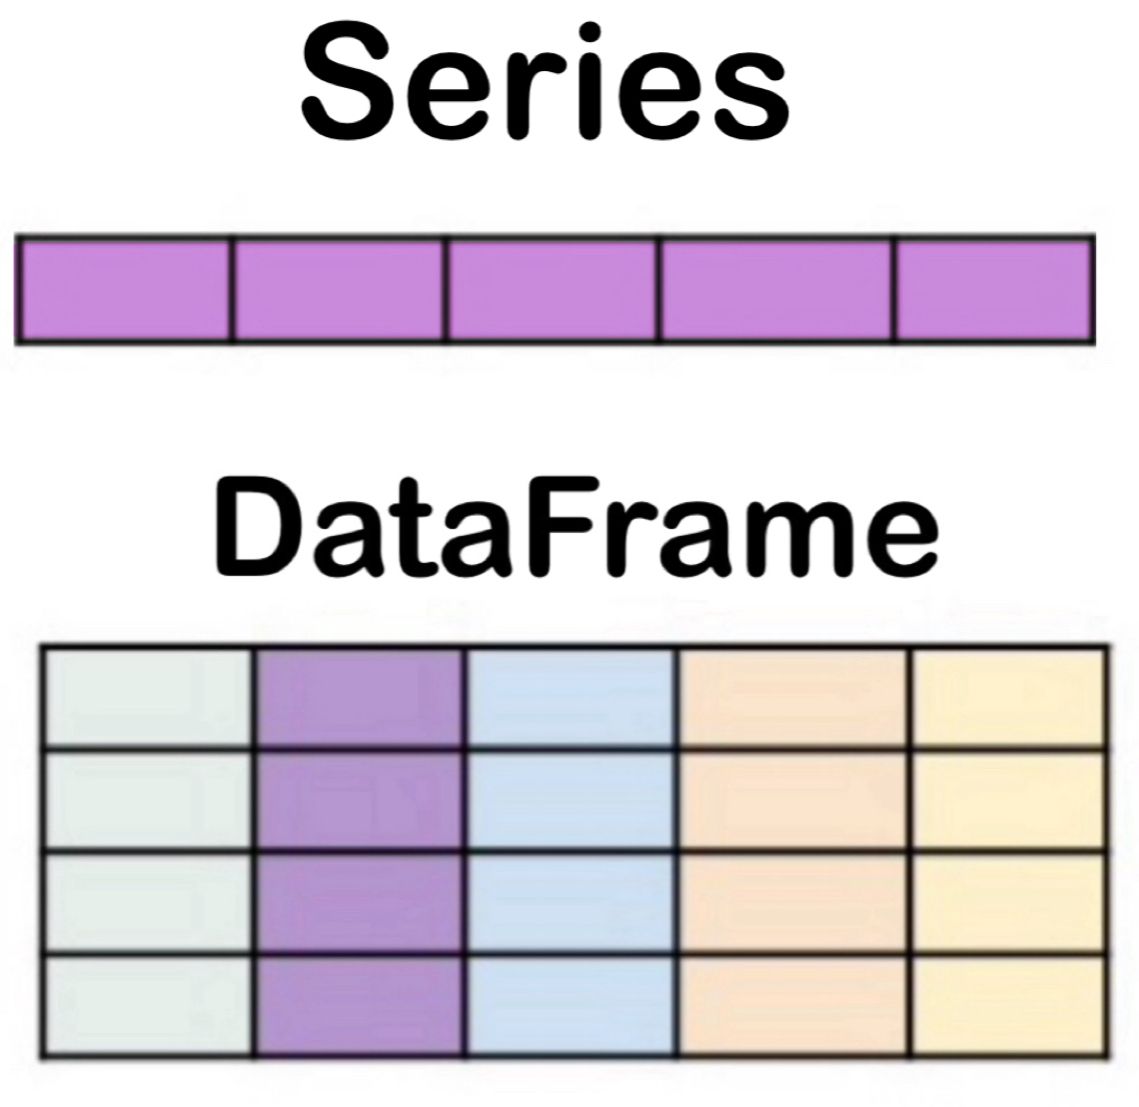
Series: a collection of a one-dimensional object containing a sequence of values.DataFrame: a collection ofSeriescolumns with an index.
Importing a data set with read_csv()
A CSV (comma-separated values) is a plain-text file that uses a comma to separate values (e.g., nba.csv).
The CSV is widely used for storing data, and we will use this throughout the module.
We use the
read_csv()function to load a CSV data file.
- The
DataFrameis the workhorse of the pandas library and the data structure.
Importing a data set with read_csv()
- We can use the
parse_datesparameter to coerce the values intodatetimes.
Loading Data
Mounting Google Drive on Google Colab
drive.mount('/content/drive')- To mount your Google Drive on Google colab:
files.upload()- To initiate uploading a file on Google Drive:
- To find a pathname of a CSV file in Google Drive:
- Click 📁 from the sidebar menu
drive➡️MyDrive…- Hover a mouse cursor on the CSV file
- Click the vertical dots
- Click “Copy path”
Loading Data
Colab’s Interactive DataFrame Display
from google.colab import data_table
data_table.enable_dataframe_formatter()  # Enabling an interactive DataFrame display
nba- Colab includes an extension that renders pandas
DataFramesinto interactive displays.
Loading Data
Another Interactive DataFrame Display
# !pip install itables
from itables import init_notebook_mode, show
init_notebook_mode(all_interactive=False)
show(nba)itablesprovides similar interactive displays forDataFrames.- For a blog post,
itables‘s interactive displays may work better thangoogle.colab’ ones.
- For a blog post,